Canadian vs Immigrants from Congo Median Earnings
COMPARE
Canadian
Immigrants from Congo
Median Earnings
Median Earnings Comparison
Canadians
Immigrants from Congo
$47,911
MEDIAN EARNINGS
88.8/ 100
METRIC RATING
139th/ 347
METRIC RANK
$39,169
MEDIAN EARNINGS
0.0/ 100
METRIC RATING
330th/ 347
METRIC RANK
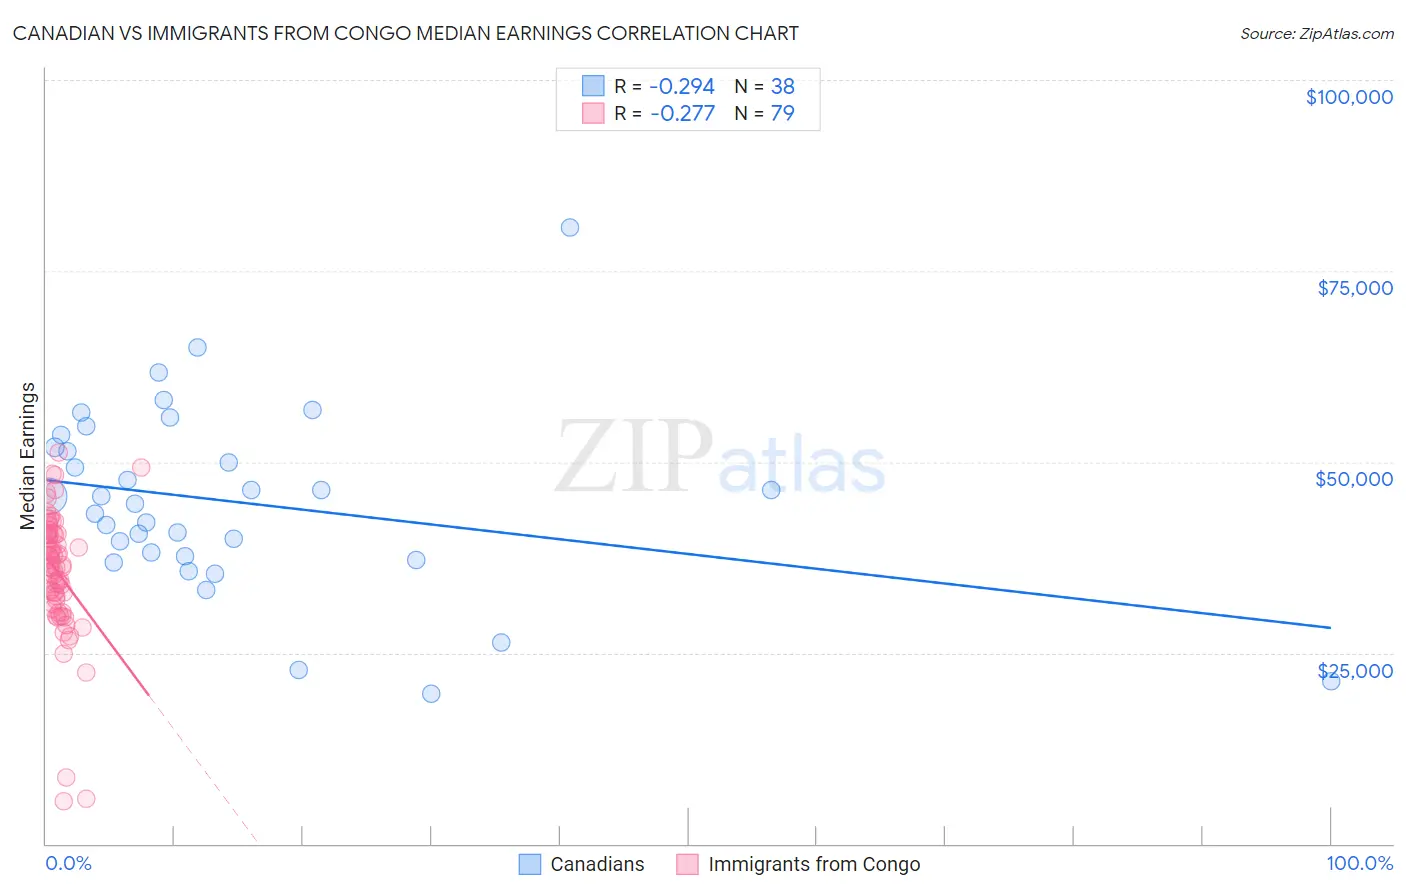
Canadian vs Immigrants from Congo Median Earnings Correlation Chart
The statistical analysis conducted on geographies consisting of 437,494,547 people shows a weak negative correlation between the proportion of Canadians and median earnings in the United States with a correlation coefficient (R) of -0.294 and weighted average of $47,911. Similarly, the statistical analysis conducted on geographies consisting of 92,120,169 people shows a weak negative correlation between the proportion of Immigrants from Congo and median earnings in the United States with a correlation coefficient (R) of -0.277 and weighted average of $39,169, a difference of 22.3%.
Median Earnings Correlation Summary
| Measurement | Canadian | Immigrants from Congo |
| Minimum | $19,688 | $5,625 |
| Maximum | $80,682 | $51,158 |
| Range | $60,994 | $45,533 |
| Mean | $44,712 | $35,599 |
| Median | $44,948 | $36,543 |
| Interquartile 25% (IQ1) | $37,642 | $31,963 |
| Interquartile 75% (IQ3) | $51,935 | $40,520 |
| Interquartile Range (IQR) | $14,293 | $8,557 |
| Standard Deviation (Sample) | $12,220 | $8,202 |
| Standard Deviation (Population) | $12,058 | $8,150 |
Similar Demographics by Median Earnings
Demographics Similar to Canadians by Median Earnings
In terms of median earnings, the demographic groups most similar to Canadians are European ($47,915, a difference of 0.010%), Taiwanese ($47,902, a difference of 0.020%), Immigrants from Nepal ($47,925, a difference of 0.030%), Immigrants from Sierra Leone ($47,875, a difference of 0.080%), and Ugandan ($47,854, a difference of 0.12%).
| Demographics | Rating | Rank | Median Earnings |
| British | 92.2 /100 | #132 | Exceptional $48,189 |
| Immigrants | Uganda | 90.5 /100 | #133 | Exceptional $48,041 |
| Sri Lankans | 90.5 /100 | #134 | Exceptional $48,040 |
| Portuguese | 90.4 /100 | #135 | Exceptional $48,032 |
| Slovenes | 90.0 /100 | #136 | Excellent $47,995 |
| Immigrants | Nepal | 89.0 /100 | #137 | Excellent $47,925 |
| Europeans | 88.9 /100 | #138 | Excellent $47,915 |
| Canadians | 88.8 /100 | #139 | Excellent $47,911 |
| Taiwanese | 88.7 /100 | #140 | Excellent $47,902 |
| Immigrants | Sierra Leone | 88.3 /100 | #141 | Excellent $47,875 |
| Ugandans | 88.0 /100 | #142 | Excellent $47,854 |
| Swedes | 88.0 /100 | #143 | Excellent $47,851 |
| Hungarians | 87.1 /100 | #144 | Excellent $47,795 |
| Immigrants | Saudi Arabia | 85.6 /100 | #145 | Excellent $47,704 |
| Immigrants | Chile | 85.5 /100 | #146 | Excellent $47,697 |
Demographics Similar to Immigrants from Congo by Median Earnings
In terms of median earnings, the demographic groups most similar to Immigrants from Congo are Immigrants from Mexico ($39,114, a difference of 0.14%), Kiowa ($39,232, a difference of 0.16%), Yakama ($39,107, a difference of 0.16%), Houma ($38,949, a difference of 0.57%), and Spanish American Indian ($38,907, a difference of 0.67%).
| Demographics | Rating | Rank | Median Earnings |
| Bahamians | 0.0 /100 | #323 | Tragic $39,735 |
| Ottawa | 0.0 /100 | #324 | Tragic $39,721 |
| Creek | 0.0 /100 | #325 | Tragic $39,648 |
| Immigrants | Yemen | 0.0 /100 | #326 | Tragic $39,540 |
| Yuman | 0.0 /100 | #327 | Tragic $39,523 |
| Sioux | 0.0 /100 | #328 | Tragic $39,448 |
| Kiowa | 0.0 /100 | #329 | Tragic $39,232 |
| Immigrants | Congo | 0.0 /100 | #330 | Tragic $39,169 |
| Immigrants | Mexico | 0.0 /100 | #331 | Tragic $39,114 |
| Yakama | 0.0 /100 | #332 | Tragic $39,107 |
| Houma | 0.0 /100 | #333 | Tragic $38,949 |
| Spanish American Indians | 0.0 /100 | #334 | Tragic $38,907 |
| Natives/Alaskans | 0.0 /100 | #335 | Tragic $38,896 |
| Crow | 0.0 /100 | #336 | Tragic $38,707 |
| Immigrants | Cuba | 0.0 /100 | #337 | Tragic $38,426 |