Immigrants from Albania vs Immigrants from Afghanistan Wage/Income Gap
COMPARE
Immigrants from Albania
Immigrants from Afghanistan
Wage/Income Gap
Wage/Income Gap Comparison
Immigrants from Albania
Immigrants from Afghanistan
24.0%
WAGE/INCOME GAP
98.4/ 100
METRIC RATING
108th/ 347
METRIC RANK
24.4%
WAGE/INCOME GAP
95.9/ 100
METRIC RATING
117th/ 347
METRIC RANK
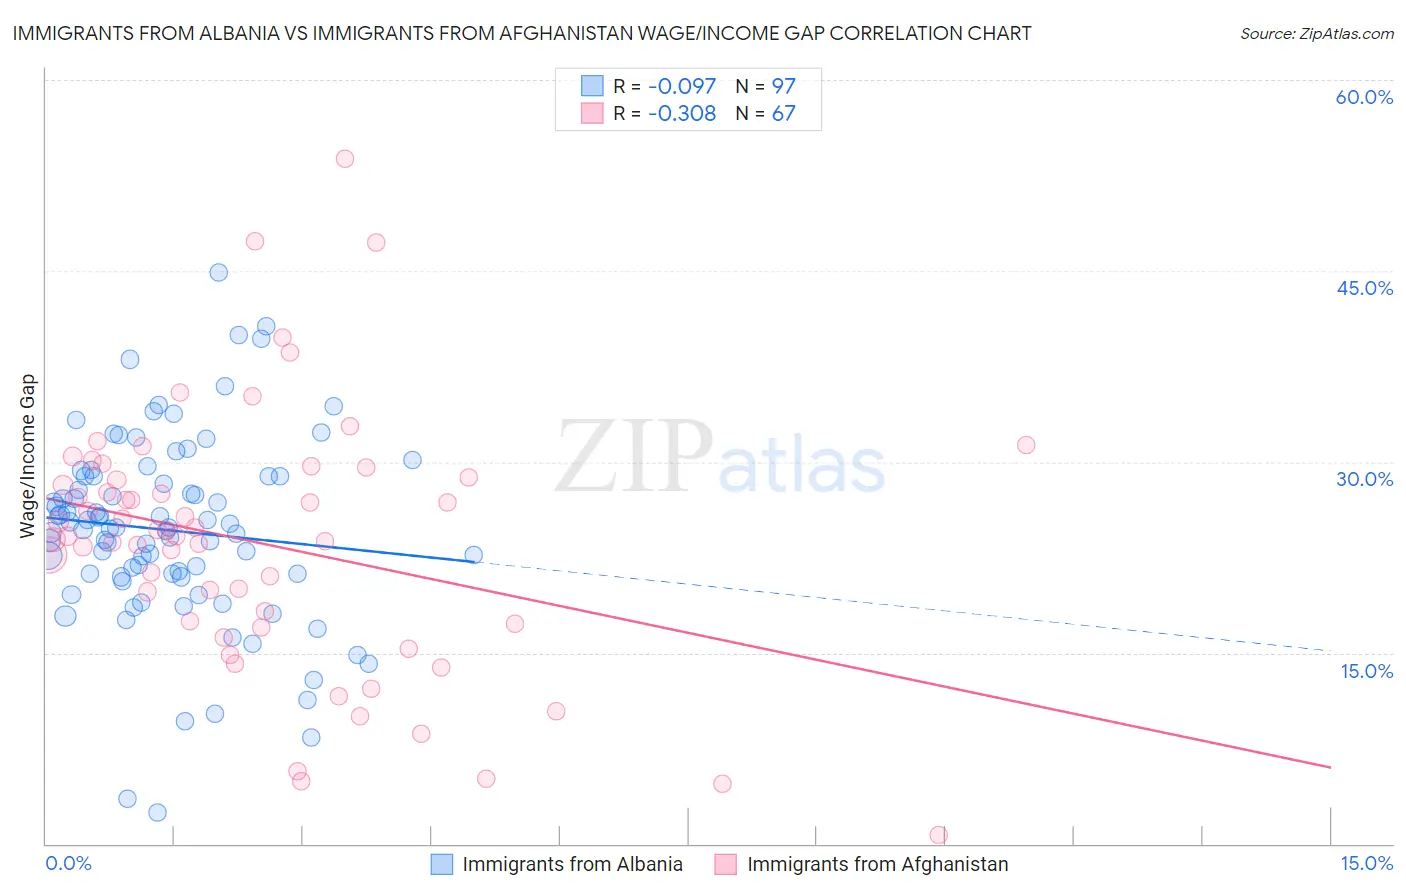
Immigrants from Albania vs Immigrants from Afghanistan Wage/Income Gap Correlation Chart
The statistical analysis conducted on geographies consisting of 119,353,518 people shows a slight negative correlation between the proportion of Immigrants from Albania and wage/income gap percentage in the United States with a correlation coefficient (R) of -0.097 and weighted average of 24.0%. Similarly, the statistical analysis conducted on geographies consisting of 147,636,341 people shows a mild negative correlation between the proportion of Immigrants from Afghanistan and wage/income gap percentage in the United States with a correlation coefficient (R) of -0.308 and weighted average of 24.4%, a difference of 1.7%.
Wage/Income Gap Correlation Summary
| Measurement | Immigrants from Albania | Immigrants from Afghanistan |
| Minimum | 2.5% | 0.66% |
| Maximum | 44.9% | 53.8% |
| Range | 42.4% | 53.1% |
| Mean | 24.6% | 23.6% |
| Median | 24.8% | 24.1% |
| Interquartile 25% (IQ1) | 21.1% | 17.3% |
| Interquartile 75% (IQ3) | 28.8% | 28.8% |
| Interquartile Range (IQR) | 7.8% | 11.5% |
| Standard Deviation (Sample) | 7.4% | 10.1% |
| Standard Deviation (Population) | 7.4% | 10.1% |
Demographics Similar to Immigrants from Albania and Immigrants from Afghanistan by Wage/Income Gap
In terms of wage/income gap, the demographic groups most similar to Immigrants from Albania are Yaqui (24.0%, a difference of 0.0%), Ugandan (24.1%, a difference of 0.060%), Immigrants from Morocco (24.1%, a difference of 0.27%), Moroccan (24.0%, a difference of 0.31%), and Sudanese (24.0%, a difference of 0.31%). Similarly, the demographic groups most similar to Immigrants from Afghanistan are Immigrants from Micronesia (24.4%, a difference of 0.030%), Kenyan (24.5%, a difference of 0.050%), Alaska Native (24.4%, a difference of 0.060%), Cree (24.5%, a difference of 0.13%), and Immigrants from Kenya (24.4%, a difference of 0.23%).
| Demographics | Rating | Rank | Wage/Income Gap |
| Immigrants | Laos | 99.0 /100 | #102 | Exceptional 23.8% |
| Tsimshian | 98.9 /100 | #103 | Exceptional 23.9% |
| Tlingit-Haida | 98.7 /100 | #104 | Exceptional 24.0% |
| Moroccans | 98.6 /100 | #105 | Exceptional 24.0% |
| Sudanese | 98.6 /100 | #106 | Exceptional 24.0% |
| Yaqui | 98.4 /100 | #107 | Exceptional 24.0% |
| Immigrants | Albania | 98.4 /100 | #108 | Exceptional 24.0% |
| Ugandans | 98.3 /100 | #109 | Exceptional 24.1% |
| Immigrants | Morocco | 98.1 /100 | #110 | Exceptional 24.1% |
| Soviet Union | 97.6 /100 | #111 | Exceptional 24.2% |
| Immigrants | Colombia | 97.0 /100 | #112 | Exceptional 24.3% |
| Sioux | 96.9 /100 | #113 | Exceptional 24.3% |
| Panamanians | 96.5 /100 | #114 | Exceptional 24.4% |
| Immigrants | Kenya | 96.4 /100 | #115 | Exceptional 24.4% |
| Alaska Natives | 96.0 /100 | #116 | Exceptional 24.4% |
| Immigrants | Afghanistan | 95.9 /100 | #117 | Exceptional 24.4% |
| Immigrants | Micronesia | 95.8 /100 | #118 | Exceptional 24.4% |
| Kenyans | 95.8 /100 | #119 | Exceptional 24.5% |
| Cree | 95.6 /100 | #120 | Exceptional 24.5% |
| Immigrants | Thailand | 94.9 /100 | #121 | Exceptional 24.5% |
| Apache | 94.8 /100 | #122 | Exceptional 24.5% |