Hispanic or Latino vs Immigrants from Nigeria Median Household Income
COMPARE
Hispanic or Latino
Immigrants from Nigeria
Median Household Income
Median Household Income Comparison
Hispanics or Latinos
Immigrants from Nigeria
$73,823
MEDIAN HOUSEHOLD INCOME
0.1/ 100
METRIC RATING
291st/ 347
METRIC RANK
$81,236
MEDIAN HOUSEHOLD INCOME
7.7/ 100
METRIC RATING
222nd/ 347
METRIC RANK
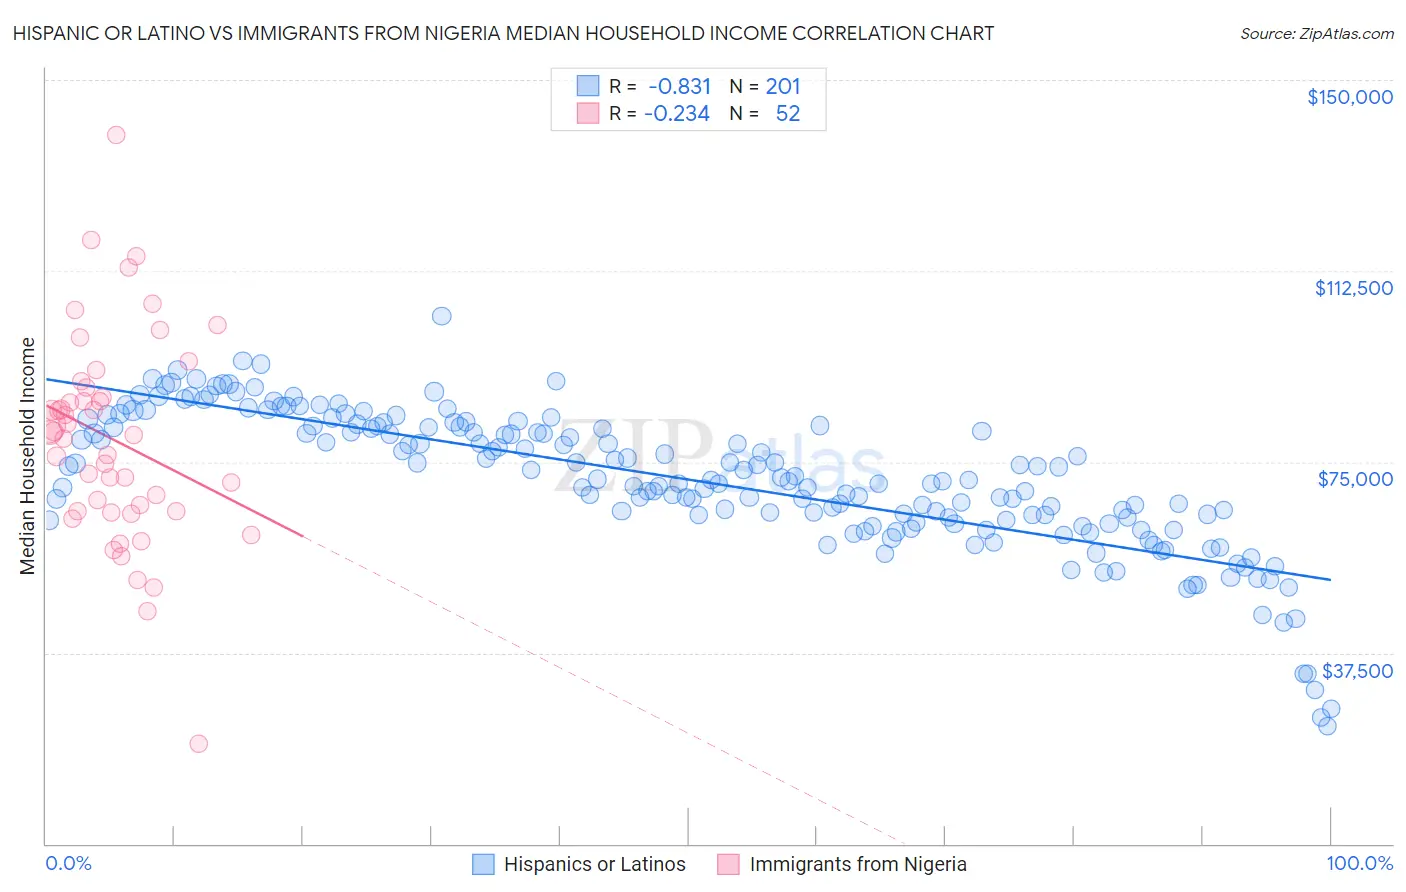
Hispanic or Latino vs Immigrants from Nigeria Median Household Income Correlation Chart
The statistical analysis conducted on geographies consisting of 577,204,907 people shows a very strong negative correlation between the proportion of Hispanics or Latinos and median household income in the United States with a correlation coefficient (R) of -0.831 and weighted average of $73,823. Similarly, the statistical analysis conducted on geographies consisting of 283,225,999 people shows a weak negative correlation between the proportion of Immigrants from Nigeria and median household income in the United States with a correlation coefficient (R) of -0.234 and weighted average of $81,236, a difference of 10.0%.
Median Household Income Correlation Summary
| Measurement | Hispanic or Latino | Immigrants from Nigeria |
| Minimum | $23,087 | $19,722 |
| Maximum | $103,536 | $139,152 |
| Range | $80,449 | $119,430 |
| Mean | $71,424 | $79,398 |
| Median | $71,562 | $80,475 |
| Interquartile 25% (IQ1) | $63,567 | $65,224 |
| Interquartile 75% (IQ3) | $81,961 | $88,599 |
| Interquartile Range (IQR) | $18,394 | $23,375 |
| Standard Deviation (Sample) | $13,788 | $20,570 |
| Standard Deviation (Population) | $13,754 | $20,371 |
Similar Demographics by Median Household Income
Demographics Similar to Hispanics or Latinos by Median Household Income
In terms of median household income, the demographic groups most similar to Hispanics or Latinos are Comanche ($73,747, a difference of 0.10%), Bangladeshi ($74,112, a difference of 0.39%), Immigrants from Cabo Verde ($73,515, a difference of 0.42%), Blackfeet ($73,509, a difference of 0.43%), and Fijian ($74,205, a difference of 0.52%).
| Demographics | Rating | Rank | Median Household Income |
| Yaqui | 0.1 /100 | #284 | Tragic $74,596 |
| Mexicans | 0.1 /100 | #285 | Tragic $74,399 |
| Immigrants | Somalia | 0.1 /100 | #286 | Tragic $74,300 |
| Iroquois | 0.1 /100 | #287 | Tragic $74,279 |
| Immigrants | Central America | 0.1 /100 | #288 | Tragic $74,217 |
| Fijians | 0.1 /100 | #289 | Tragic $74,205 |
| Bangladeshis | 0.1 /100 | #290 | Tragic $74,112 |
| Hispanics or Latinos | 0.1 /100 | #291 | Tragic $73,823 |
| Comanche | 0.1 /100 | #292 | Tragic $73,747 |
| Immigrants | Cabo Verde | 0.1 /100 | #293 | Tragic $73,515 |
| Blackfeet | 0.1 /100 | #294 | Tragic $73,509 |
| Cubans | 0.1 /100 | #295 | Tragic $73,392 |
| Haitians | 0.1 /100 | #296 | Tragic $73,306 |
| Immigrants | Mexico | 0.0 /100 | #297 | Tragic $73,160 |
| Paiute | 0.0 /100 | #298 | Tragic $72,959 |
Demographics Similar to Immigrants from Nigeria by Median Household Income
In terms of median household income, the demographic groups most similar to Immigrants from Nigeria are Immigrants from El Salvador ($81,213, a difference of 0.030%), Malaysian ($81,064, a difference of 0.21%), Immigrants from Ghana ($81,489, a difference of 0.31%), Immigrants from Venezuela ($81,506, a difference of 0.33%), and Scotch-Irish ($80,972, a difference of 0.33%).
| Demographics | Rating | Rank | Median Household Income |
| Vietnamese | 13.8 /100 | #215 | Poor $82,248 |
| Yugoslavians | 13.3 /100 | #216 | Poor $82,186 |
| Ecuadorians | 12.5 /100 | #217 | Poor $82,070 |
| Whites/Caucasians | 12.2 /100 | #218 | Poor $82,029 |
| Nigerians | 10.3 /100 | #219 | Poor $81,725 |
| Immigrants | Venezuela | 9.0 /100 | #220 | Tragic $81,506 |
| Immigrants | Ghana | 9.0 /100 | #221 | Tragic $81,489 |
| Immigrants | Nigeria | 7.7 /100 | #222 | Tragic $81,236 |
| Immigrants | El Salvador | 7.6 /100 | #223 | Tragic $81,213 |
| Malaysians | 7.0 /100 | #224 | Tragic $81,064 |
| Scotch-Irish | 6.6 /100 | #225 | Tragic $80,972 |
| Immigrants | Panama | 6.2 /100 | #226 | Tragic $80,873 |
| Guyanese | 5.7 /100 | #227 | Tragic $80,734 |
| Immigrants | Bangladesh | 5.7 /100 | #228 | Tragic $80,722 |
| Delaware | 5.0 /100 | #229 | Tragic $80,527 |