Hispanic or Latino vs Immigrants from Burma/Myanmar Median Household Income
COMPARE
Hispanic or Latino
Immigrants from Burma/Myanmar
Median Household Income
Median Household Income Comparison
Hispanics or Latinos
Immigrants from Burma/Myanmar
$73,823
MEDIAN HOUSEHOLD INCOME
0.1/ 100
METRIC RATING
291st/ 347
METRIC RANK
$78,682
MEDIAN HOUSEHOLD INCOME
1.6/ 100
METRIC RATING
247th/ 347
METRIC RANK
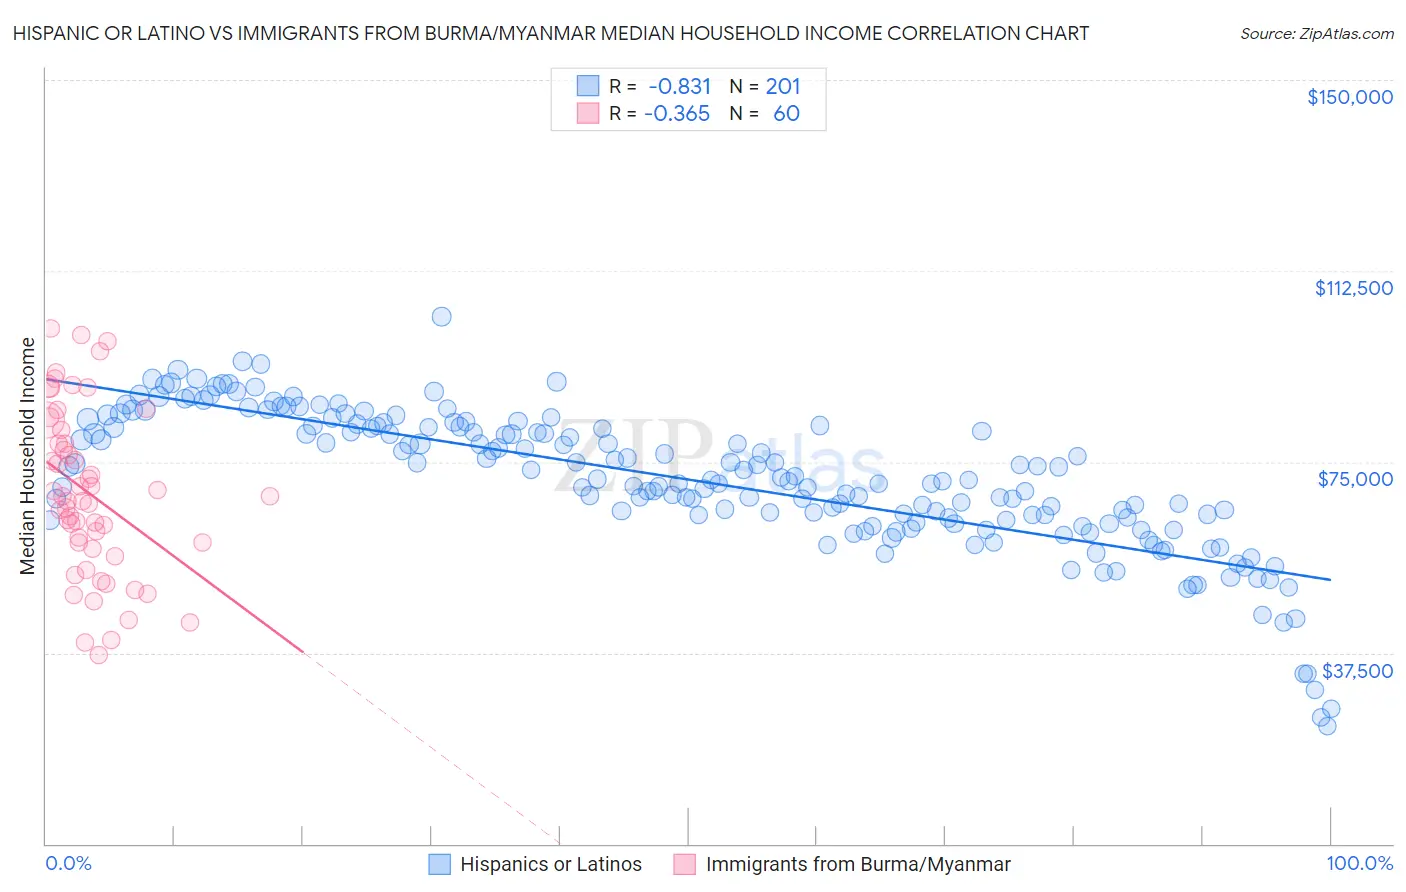
Hispanic or Latino vs Immigrants from Burma/Myanmar Median Household Income Correlation Chart
The statistical analysis conducted on geographies consisting of 577,204,907 people shows a very strong negative correlation between the proportion of Hispanics or Latinos and median household income in the United States with a correlation coefficient (R) of -0.831 and weighted average of $73,823. Similarly, the statistical analysis conducted on geographies consisting of 172,235,466 people shows a mild negative correlation between the proportion of Immigrants from Burma/Myanmar and median household income in the United States with a correlation coefficient (R) of -0.365 and weighted average of $78,682, a difference of 6.6%.
Median Household Income Correlation Summary
| Measurement | Hispanic or Latino | Immigrants from Burma/Myanmar |
| Minimum | $23,087 | $36,966 |
| Maximum | $103,536 | $101,230 |
| Range | $80,449 | $64,264 |
| Mean | $71,424 | $68,823 |
| Median | $71,562 | $67,779 |
| Interquartile 25% (IQ1) | $63,567 | $58,487 |
| Interquartile 75% (IQ3) | $81,961 | $79,866 |
| Interquartile Range (IQR) | $18,394 | $21,379 |
| Standard Deviation (Sample) | $13,788 | $16,228 |
| Standard Deviation (Population) | $13,754 | $16,092 |
Similar Demographics by Median Household Income
Demographics Similar to Hispanics or Latinos by Median Household Income
In terms of median household income, the demographic groups most similar to Hispanics or Latinos are Comanche ($73,747, a difference of 0.10%), Bangladeshi ($74,112, a difference of 0.39%), Immigrants from Cabo Verde ($73,515, a difference of 0.42%), Blackfeet ($73,509, a difference of 0.43%), and Fijian ($74,205, a difference of 0.52%).
| Demographics | Rating | Rank | Median Household Income |
| Yaqui | 0.1 /100 | #284 | Tragic $74,596 |
| Mexicans | 0.1 /100 | #285 | Tragic $74,399 |
| Immigrants | Somalia | 0.1 /100 | #286 | Tragic $74,300 |
| Iroquois | 0.1 /100 | #287 | Tragic $74,279 |
| Immigrants | Central America | 0.1 /100 | #288 | Tragic $74,217 |
| Fijians | 0.1 /100 | #289 | Tragic $74,205 |
| Bangladeshis | 0.1 /100 | #290 | Tragic $74,112 |
| Hispanics or Latinos | 0.1 /100 | #291 | Tragic $73,823 |
| Comanche | 0.1 /100 | #292 | Tragic $73,747 |
| Immigrants | Cabo Verde | 0.1 /100 | #293 | Tragic $73,515 |
| Blackfeet | 0.1 /100 | #294 | Tragic $73,509 |
| Cubans | 0.1 /100 | #295 | Tragic $73,392 |
| Haitians | 0.1 /100 | #296 | Tragic $73,306 |
| Immigrants | Mexico | 0.0 /100 | #297 | Tragic $73,160 |
| Paiute | 0.0 /100 | #298 | Tragic $72,959 |
Demographics Similar to Immigrants from Burma/Myanmar by Median Household Income
In terms of median household income, the demographic groups most similar to Immigrants from Burma/Myanmar are Central American ($78,803, a difference of 0.15%), Sudanese ($78,529, a difference of 0.19%), Inupiat ($78,841, a difference of 0.20%), West Indian ($78,455, a difference of 0.29%), and Marshallese ($78,930, a difference of 0.32%).
| Demographics | Rating | Rank | Median Household Income |
| Immigrants | Western Africa | 2.7 /100 | #240 | Tragic $79,490 |
| Immigrants | Nonimmigrants | 2.6 /100 | #241 | Tragic $79,429 |
| Immigrants | Sudan | 2.1 /100 | #242 | Tragic $79,103 |
| Immigrants | Barbados | 1.9 /100 | #243 | Tragic $78,989 |
| Marshallese | 1.9 /100 | #244 | Tragic $78,930 |
| Inupiat | 1.8 /100 | #245 | Tragic $78,841 |
| Central Americans | 1.7 /100 | #246 | Tragic $78,803 |
| Immigrants | Burma/Myanmar | 1.6 /100 | #247 | Tragic $78,682 |
| Sudanese | 1.5 /100 | #248 | Tragic $78,529 |
| West Indians | 1.4 /100 | #249 | Tragic $78,455 |
| Immigrants | Laos | 1.3 /100 | #250 | Tragic $78,327 |
| Mexican American Indians | 1.2 /100 | #251 | Tragic $78,166 |
| Immigrants | West Indies | 1.0 /100 | #252 | Tragic $77,956 |
| Immigrants | St. Vincent and the Grenadines | 0.9 /100 | #253 | Tragic $77,690 |
| Sub-Saharan Africans | 0.8 /100 | #254 | Tragic $77,631 |