Hispanic or Latino vs Arapaho Median Household Income
COMPARE
Hispanic or Latino
Arapaho
Median Household Income
Median Household Income Comparison
Hispanics or Latinos
Arapaho
$73,823
MEDIAN HOUSEHOLD INCOME
0.1/ 100
METRIC RATING
291st/ 347
METRIC RANK
$67,965
MEDIAN HOUSEHOLD INCOME
0.0/ 100
METRIC RATING
330th/ 347
METRIC RANK
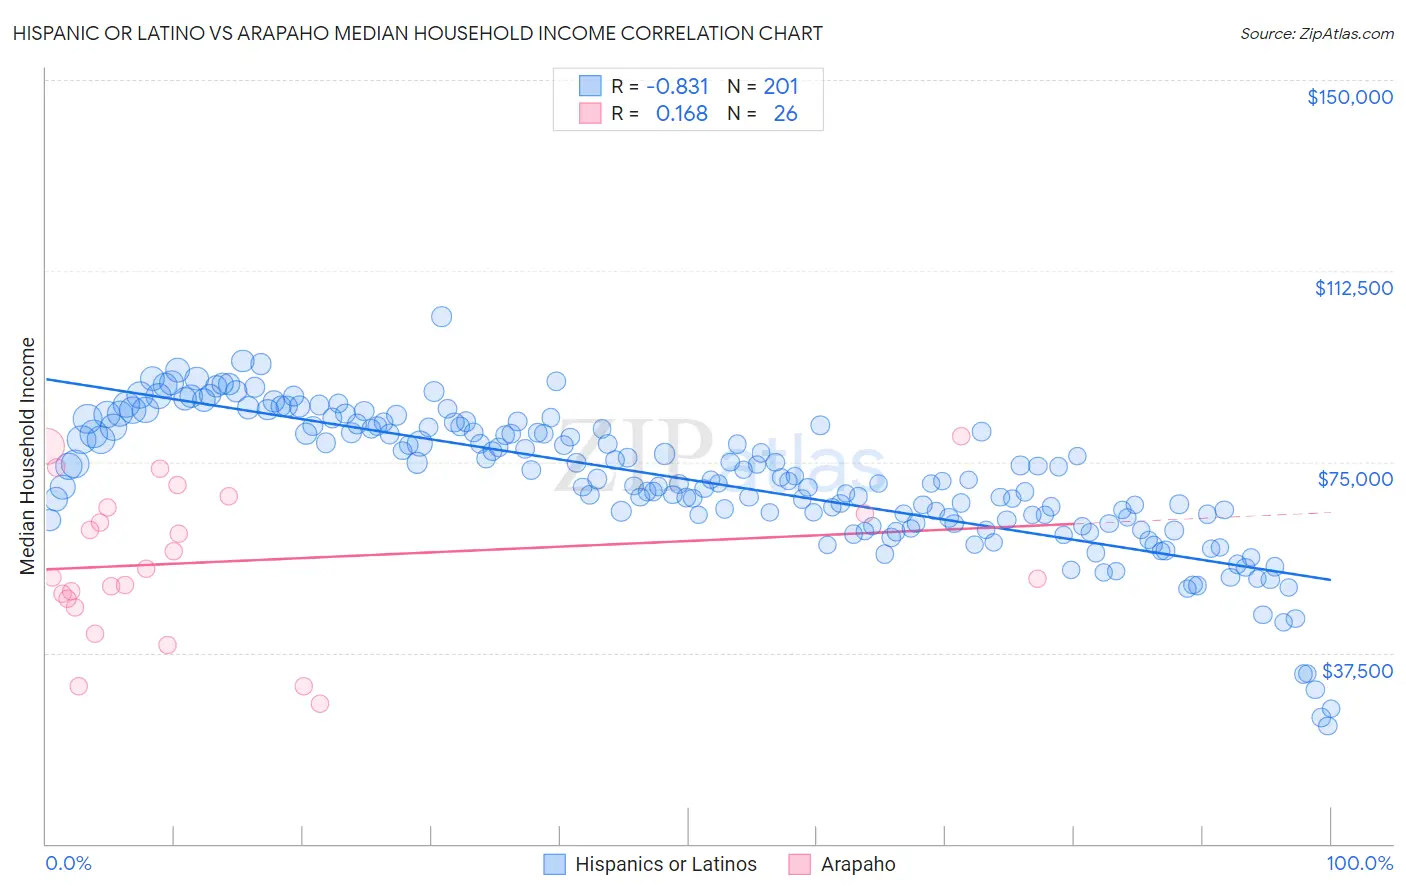
Hispanic or Latino vs Arapaho Median Household Income Correlation Chart
The statistical analysis conducted on geographies consisting of 577,204,907 people shows a very strong negative correlation between the proportion of Hispanics or Latinos and median household income in the United States with a correlation coefficient (R) of -0.831 and weighted average of $73,823. Similarly, the statistical analysis conducted on geographies consisting of 29,777,139 people shows a poor positive correlation between the proportion of Arapaho and median household income in the United States with a correlation coefficient (R) of 0.168 and weighted average of $67,965, a difference of 8.6%.
Median Household Income Correlation Summary
| Measurement | Hispanic or Latino | Arapaho |
| Minimum | $23,087 | $27,500 |
| Maximum | $103,536 | $80,000 |
| Range | $80,449 | $52,500 |
| Mean | $71,424 | $55,430 |
| Median | $71,562 | $53,182 |
| Interquartile 25% (IQ1) | $63,567 | $47,998 |
| Interquartile 75% (IQ3) | $81,961 | $66,111 |
| Interquartile Range (IQR) | $18,394 | $18,113 |
| Standard Deviation (Sample) | $13,788 | $14,479 |
| Standard Deviation (Population) | $13,754 | $14,198 |
Similar Demographics by Median Household Income
Demographics Similar to Hispanics or Latinos by Median Household Income
In terms of median household income, the demographic groups most similar to Hispanics or Latinos are Comanche ($73,747, a difference of 0.10%), Bangladeshi ($74,112, a difference of 0.39%), Immigrants from Cabo Verde ($73,515, a difference of 0.42%), Blackfeet ($73,509, a difference of 0.43%), and Fijian ($74,205, a difference of 0.52%).
| Demographics | Rating | Rank | Median Household Income |
| Yaqui | 0.1 /100 | #284 | Tragic $74,596 |
| Mexicans | 0.1 /100 | #285 | Tragic $74,399 |
| Immigrants | Somalia | 0.1 /100 | #286 | Tragic $74,300 |
| Iroquois | 0.1 /100 | #287 | Tragic $74,279 |
| Immigrants | Central America | 0.1 /100 | #288 | Tragic $74,217 |
| Fijians | 0.1 /100 | #289 | Tragic $74,205 |
| Bangladeshis | 0.1 /100 | #290 | Tragic $74,112 |
| Hispanics or Latinos | 0.1 /100 | #291 | Tragic $73,823 |
| Comanche | 0.1 /100 | #292 | Tragic $73,747 |
| Immigrants | Cabo Verde | 0.1 /100 | #293 | Tragic $73,515 |
| Blackfeet | 0.1 /100 | #294 | Tragic $73,509 |
| Cubans | 0.1 /100 | #295 | Tragic $73,392 |
| Haitians | 0.1 /100 | #296 | Tragic $73,306 |
| Immigrants | Mexico | 0.0 /100 | #297 | Tragic $73,160 |
| Paiute | 0.0 /100 | #298 | Tragic $72,959 |
Demographics Similar to Arapaho by Median Household Income
In terms of median household income, the demographic groups most similar to Arapaho are Native/Alaskan ($67,879, a difference of 0.13%), Sioux ($67,792, a difference of 0.25%), Creek ($67,715, a difference of 0.37%), Black/African American ($67,573, a difference of 0.58%), and Dutch West Indian ($68,412, a difference of 0.66%).
| Demographics | Rating | Rank | Median Household Income |
| Bahamians | 0.0 /100 | #323 | Tragic $69,726 |
| Yup'ik | 0.0 /100 | #324 | Tragic $69,695 |
| Seminole | 0.0 /100 | #325 | Tragic $69,420 |
| Yuman | 0.0 /100 | #326 | Tragic $68,743 |
| Immigrants | Cuba | 0.0 /100 | #327 | Tragic $68,461 |
| Menominee | 0.0 /100 | #328 | Tragic $68,423 |
| Dutch West Indians | 0.0 /100 | #329 | Tragic $68,412 |
| Arapaho | 0.0 /100 | #330 | Tragic $67,965 |
| Natives/Alaskans | 0.0 /100 | #331 | Tragic $67,879 |
| Sioux | 0.0 /100 | #332 | Tragic $67,792 |
| Creek | 0.0 /100 | #333 | Tragic $67,715 |
| Blacks/African Americans | 0.0 /100 | #334 | Tragic $67,573 |
| Cheyenne | 0.0 /100 | #335 | Tragic $66,974 |
| Immigrants | Congo | 0.0 /100 | #336 | Tragic $66,768 |
| Kiowa | 0.0 /100 | #337 | Tragic $65,914 |