Hispanic or Latino vs British West Indian Ambulatory Disability
COMPARE
Hispanic or Latino
British West Indian
Ambulatory Disability
Ambulatory Disability Comparison
Hispanics or Latinos
British West Indians
6.4%
AMBULATORY DISABILITY
2.2/ 100
METRIC RATING
235th/ 347
METRIC RANK
7.0%
AMBULATORY DISABILITY
0.0/ 100
METRIC RATING
301st/ 347
METRIC RANK
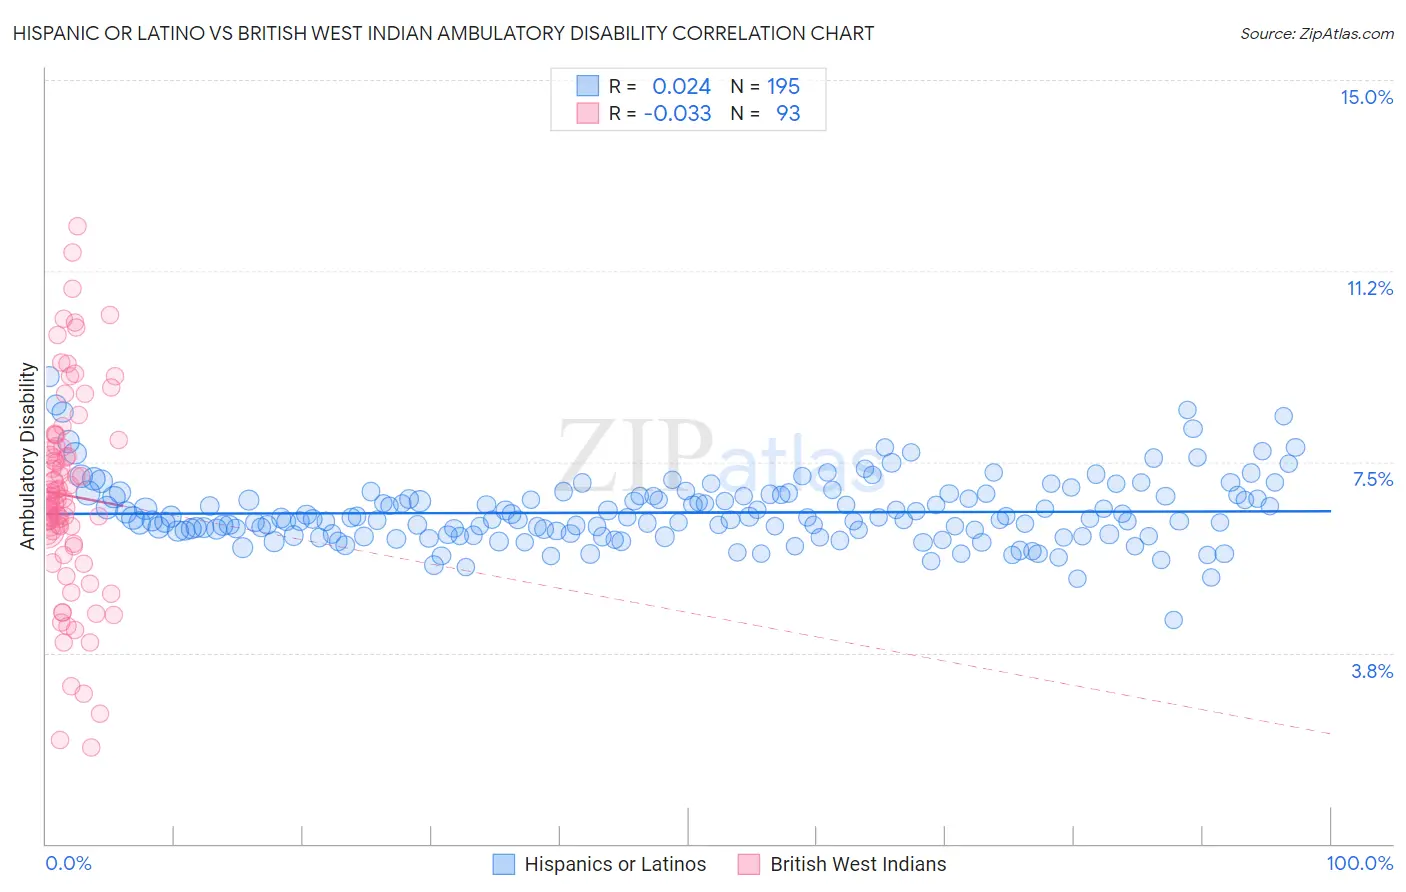
Hispanic or Latino vs British West Indian Ambulatory Disability Correlation Chart
The statistical analysis conducted on geographies consisting of 572,469,194 people shows no correlation between the proportion of Hispanics or Latinos and percentage of population with ambulatory disability in the United States with a correlation coefficient (R) of 0.024 and weighted average of 6.4%. Similarly, the statistical analysis conducted on geographies consisting of 152,684,150 people shows no correlation between the proportion of British West Indians and percentage of population with ambulatory disability in the United States with a correlation coefficient (R) of -0.033 and weighted average of 7.0%, a difference of 8.4%.
Ambulatory Disability Correlation Summary
| Measurement | Hispanic or Latino | British West Indian |
| Minimum | 4.4% | 1.9% |
| Maximum | 9.2% | 12.1% |
| Range | 4.8% | 10.2% |
| Mean | 6.5% | 6.8% |
| Median | 6.4% | 6.8% |
| Interquartile 25% (IQ1) | 6.1% | 6.0% |
| Interquartile 75% (IQ3) | 6.8% | 7.8% |
| Interquartile Range (IQR) | 0.75% | 1.8% |
| Standard Deviation (Sample) | 0.65% | 2.0% |
| Standard Deviation (Population) | 0.65% | 2.0% |
Similar Demographics by Ambulatory Disability
Demographics Similar to Hispanics or Latinos by Ambulatory Disability
In terms of ambulatory disability, the demographic groups most similar to Hispanics or Latinos are Immigrants from Liberia (6.4%, a difference of 0.030%), Subsaharan African (6.4%, a difference of 0.060%), Assyrian/Chaldean/Syriac (6.4%, a difference of 0.12%), Dutch (6.4%, a difference of 0.15%), and Immigrants from Germany (6.4%, a difference of 0.24%).
| Demographics | Rating | Rank | Ambulatory Disability |
| Portuguese | 4.0 /100 | #228 | Tragic 6.4% |
| Czechoslovakians | 3.8 /100 | #229 | Tragic 6.4% |
| Mexicans | 3.5 /100 | #230 | Tragic 6.4% |
| Panamanians | 3.1 /100 | #231 | Tragic 6.4% |
| Assyrians/Chaldeans/Syriacs | 2.4 /100 | #232 | Tragic 6.4% |
| Sub-Saharan Africans | 2.3 /100 | #233 | Tragic 6.4% |
| Immigrants | Liberia | 2.3 /100 | #234 | Tragic 6.4% |
| Hispanics or Latinos | 2.2 /100 | #235 | Tragic 6.4% |
| Dutch | 2.0 /100 | #236 | Tragic 6.4% |
| Immigrants | Germany | 1.8 /100 | #237 | Tragic 6.4% |
| Haitians | 1.8 /100 | #238 | Tragic 6.4% |
| Senegalese | 1.7 /100 | #239 | Tragic 6.4% |
| Immigrants | Senegal | 1.7 /100 | #240 | Tragic 6.4% |
| Immigrants | Haiti | 1.6 /100 | #241 | Tragic 6.5% |
| Spaniards | 1.6 /100 | #242 | Tragic 6.5% |
Demographics Similar to British West Indians by Ambulatory Disability
In terms of ambulatory disability, the demographic groups most similar to British West Indians are Immigrants from Armenia (7.0%, a difference of 0.060%), African (7.0%, a difference of 0.11%), Marshallese (6.9%, a difference of 0.23%), Puget Sound Salish (6.9%, a difference of 0.24%), and Immigrants from Grenada (6.9%, a difference of 0.37%).
| Demographics | Rating | Rank | Ambulatory Disability |
| Cape Verdeans | 0.0 /100 | #294 | Tragic 6.9% |
| Crow | 0.0 /100 | #295 | Tragic 6.9% |
| Alaskan Athabascans | 0.0 /100 | #296 | Tragic 6.9% |
| French American Indians | 0.0 /100 | #297 | Tragic 6.9% |
| Immigrants | Grenada | 0.0 /100 | #298 | Tragic 6.9% |
| Puget Sound Salish | 0.0 /100 | #299 | Tragic 6.9% |
| Marshallese | 0.0 /100 | #300 | Tragic 6.9% |
| British West Indians | 0.0 /100 | #301 | Tragic 7.0% |
| Immigrants | Armenia | 0.0 /100 | #302 | Tragic 7.0% |
| Africans | 0.0 /100 | #303 | Tragic 7.0% |
| Immigrants | Cabo Verde | 0.0 /100 | #304 | Tragic 7.0% |
| Immigrants | Micronesia | 0.0 /100 | #305 | Tragic 7.0% |
| Iroquois | 0.0 /100 | #306 | Tragic 7.1% |
| Spanish Americans | 0.0 /100 | #307 | Tragic 7.1% |
| Chippewa | 0.0 /100 | #308 | Tragic 7.1% |