Hawaiian vs Israeli Average Family Size
COMPARE
Hawaiian
Israeli
Average Family Size
Average Family Size Comparison
Hawaiians
Israelis
3.41
AVERAGE FAMILY SIZE
100.0/ 100
METRIC RATING
33rd/ 347
METRIC RANK
3.23
AVERAGE FAMILY SIZE
48.7/ 100
METRIC RATING
176th/ 347
METRIC RANK
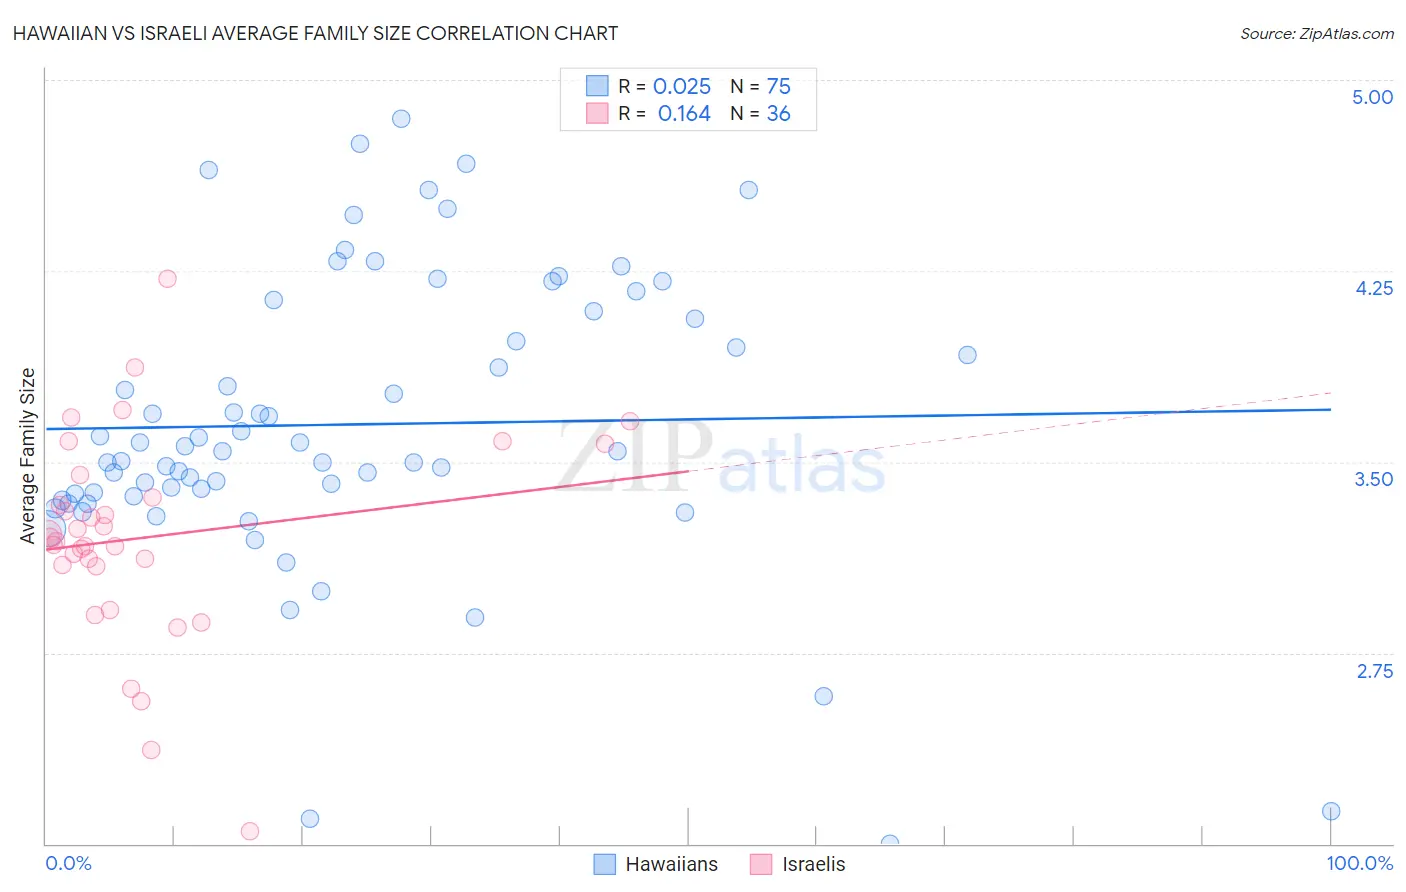
Hawaiian vs Israeli Average Family Size Correlation Chart
The statistical analysis conducted on geographies consisting of 327,392,742 people shows no correlation between the proportion of Hawaiians and average family size in the United States with a correlation coefficient (R) of 0.025 and weighted average of 3.41. Similarly, the statistical analysis conducted on geographies consisting of 211,000,006 people shows a poor positive correlation between the proportion of Israelis and average family size in the United States with a correlation coefficient (R) of 0.164 and weighted average of 3.23, a difference of 5.6%.
Average Family Size Correlation Summary
| Measurement | Hawaiian | Israeli |
| Minimum | 2.00 | 2.05 |
| Maximum | 4.85 | 4.22 |
| Range | 2.85 | 2.17 |
| Mean | 3.65 | 3.20 |
| Median | 3.54 | 3.20 |
| Interquartile 25% (IQ1) | 3.37 | 3.09 |
| Interquartile 75% (IQ3) | 4.09 | 3.40 |
| Interquartile Range (IQR) | 0.72 | 0.31 |
| Standard Deviation (Sample) | 0.58 | 0.41 |
| Standard Deviation (Population) | 0.57 | 0.41 |
Similar Demographics by Average Family Size
Demographics Similar to Hawaiians by Average Family Size
In terms of average family size, the demographic groups most similar to Hawaiians are Immigrants from Guatemala (3.41, a difference of 0.030%), Hispanic or Latino (3.41, a difference of 0.050%), Central American (3.41, a difference of 0.12%), Guatemalan (3.40, a difference of 0.12%), and Immigrants from Guyana (3.40, a difference of 0.16%).
| Demographics | Rating | Rank | Average Family Size |
| Native Hawaiians | 100.0 /100 | #26 | Exceptional 3.43 |
| Mexican American Indians | 100.0 /100 | #27 | Exceptional 3.43 |
| Immigrants | Latin America | 100.0 /100 | #28 | Exceptional 3.42 |
| Nepalese | 100.0 /100 | #29 | Exceptional 3.42 |
| Samoans | 100.0 /100 | #30 | Exceptional 3.42 |
| Central Americans | 100.0 /100 | #31 | Exceptional 3.41 |
| Immigrants | Guatemala | 100.0 /100 | #32 | Exceptional 3.41 |
| Hawaiians | 100.0 /100 | #33 | Exceptional 3.41 |
| Hispanics or Latinos | 100.0 /100 | #34 | Exceptional 3.41 |
| Guatemalans | 100.0 /100 | #35 | Exceptional 3.40 |
| Immigrants | Guyana | 100.0 /100 | #36 | Exceptional 3.40 |
| Guyanese | 100.0 /100 | #37 | Exceptional 3.40 |
| Immigrants | Belize | 100.0 /100 | #38 | Exceptional 3.39 |
| Immigrants | Haiti | 100.0 /100 | #39 | Exceptional 3.39 |
| Belizeans | 100.0 /100 | #40 | Exceptional 3.39 |
Demographics Similar to Israelis by Average Family Size
In terms of average family size, the demographic groups most similar to Israelis are Immigrants from South Central Asia (3.23, a difference of 0.020%), Immigrants from China (3.23, a difference of 0.020%), Argentinean (3.23, a difference of 0.020%), Spaniard (3.23, a difference of 0.030%), and Immigrants from Korea (3.23, a difference of 0.030%).
| Demographics | Rating | Rank | Average Family Size |
| Aleuts | 54.1 /100 | #169 | Average 3.23 |
| Arabs | 53.8 /100 | #170 | Average 3.23 |
| Chileans | 53.2 /100 | #171 | Average 3.23 |
| Immigrants | Congo | 52.7 /100 | #172 | Average 3.23 |
| Immigrants | Uruguay | 52.0 /100 | #173 | Average 3.23 |
| Immigrants | South Central Asia | 50.0 /100 | #174 | Average 3.23 |
| Immigrants | China | 49.9 /100 | #175 | Average 3.23 |
| Israelis | 48.7 /100 | #176 | Average 3.23 |
| Argentineans | 47.4 /100 | #177 | Average 3.23 |
| Spaniards | 47.2 /100 | #178 | Average 3.23 |
| Immigrants | Korea | 46.9 /100 | #179 | Average 3.23 |
| Palestinians | 46.6 /100 | #180 | Average 3.23 |
| Spanish | 44.8 /100 | #181 | Average 3.23 |
| Moroccans | 44.2 /100 | #182 | Average 3.22 |
| Immigrants | Northern Africa | 41.7 /100 | #183 | Average 3.22 |