Nicaraguan vs Israeli Wage/Income Gap
COMPARE
Nicaraguan
Israeli
Wage/Income Gap
Wage/Income Gap Comparison
Nicaraguans
Israelis
23.4%
WAGE/INCOME GAP
99.6/ 100
METRIC RATING
90th/ 347
METRIC RANK
27.4%
WAGE/INCOME GAP
2.1/ 100
METRIC RATING
254th/ 347
METRIC RANK
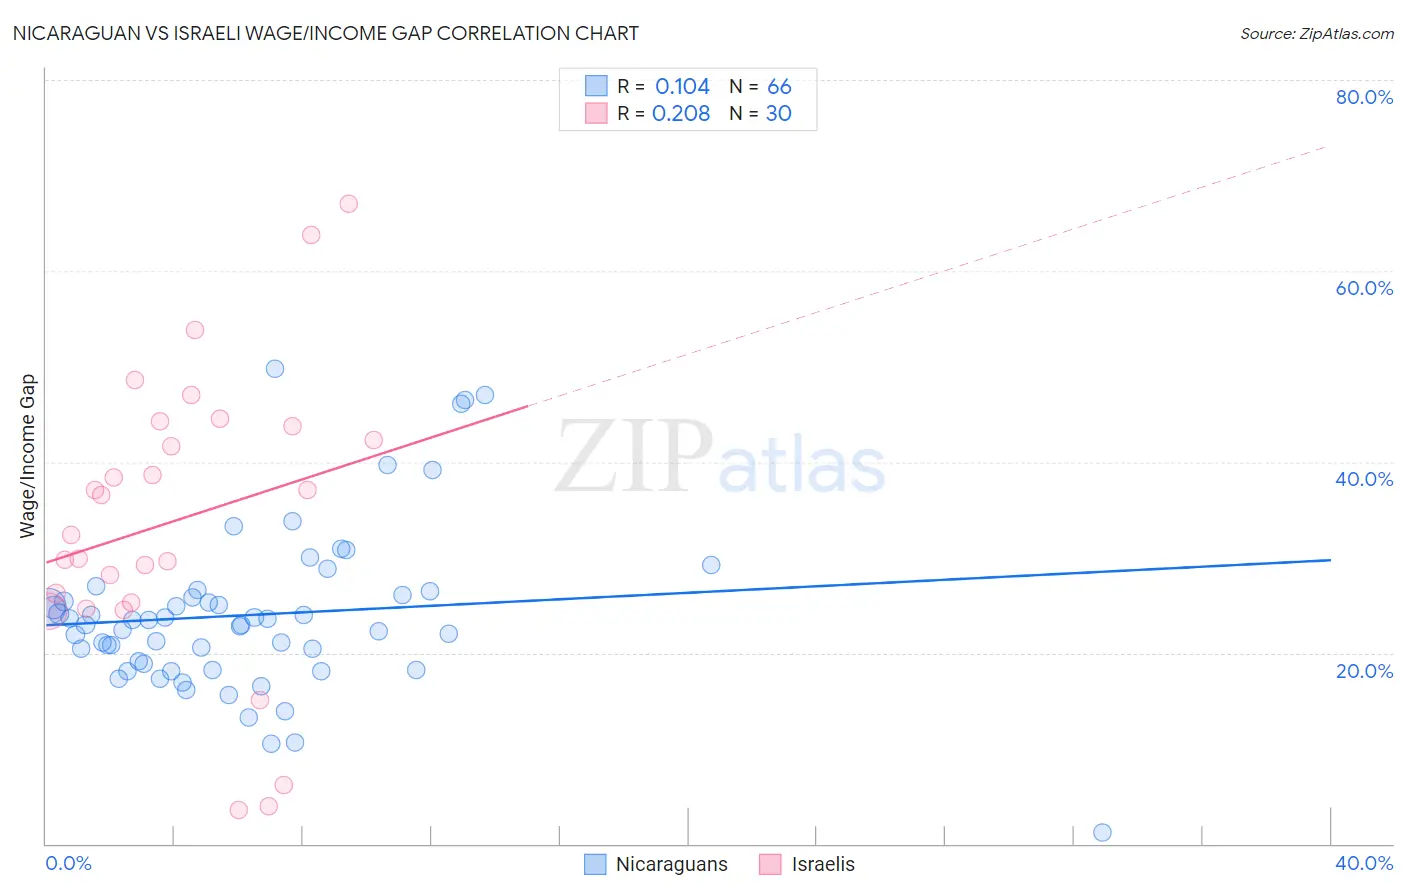
Nicaraguan vs Israeli Wage/Income Gap Correlation Chart
The statistical analysis conducted on geographies consisting of 285,636,386 people shows a poor positive correlation between the proportion of Nicaraguans and wage/income gap percentage in the United States with a correlation coefficient (R) of 0.104 and weighted average of 23.4%. Similarly, the statistical analysis conducted on geographies consisting of 211,160,371 people shows a weak positive correlation between the proportion of Israelis and wage/income gap percentage in the United States with a correlation coefficient (R) of 0.208 and weighted average of 27.4%, a difference of 16.9%.
Wage/Income Gap Correlation Summary
| Measurement | Nicaraguan | Israeli |
| Minimum | 1.2% | 3.5% |
| Maximum | 49.8% | 67.0% |
| Range | 48.6% | 63.5% |
| Mean | 24.0% | 33.9% |
| Median | 23.2% | 34.4% |
| Interquartile 25% (IQ1) | 18.9% | 25.3% |
| Interquartile 75% (IQ3) | 26.0% | 43.8% |
| Interquartile Range (IQR) | 7.1% | 18.5% |
| Standard Deviation (Sample) | 8.6% | 15.2% |
| Standard Deviation (Population) | 8.5% | 15.0% |
Similar Demographics by Wage/Income Gap
Demographics Similar to Nicaraguans by Wage/Income Gap
In terms of wage/income gap, the demographic groups most similar to Nicaraguans are Marshallese (23.4%, a difference of 0.010%), Immigrants from Panama (23.4%, a difference of 0.10%), Arapaho (23.5%, a difference of 0.14%), Immigrants from Honduras (23.5%, a difference of 0.29%), and Yuman (23.3%, a difference of 0.42%).
| Demographics | Rating | Rank | Wage/Income Gap |
| Immigrants | Africa | 99.8 /100 | #83 | Exceptional 23.2% |
| Cubans | 99.7 /100 | #84 | Exceptional 23.3% |
| Immigrants | Cambodia | 99.7 /100 | #85 | Exceptional 23.3% |
| Cheyenne | 99.7 /100 | #86 | Exceptional 23.3% |
| Yuman | 99.7 /100 | #87 | Exceptional 23.3% |
| Immigrants | Panama | 99.6 /100 | #88 | Exceptional 23.4% |
| Marshallese | 99.6 /100 | #89 | Exceptional 23.4% |
| Nicaraguans | 99.6 /100 | #90 | Exceptional 23.4% |
| Arapaho | 99.6 /100 | #91 | Exceptional 23.5% |
| Immigrants | Honduras | 99.5 /100 | #92 | Exceptional 23.5% |
| Immigrants | Cabo Verde | 99.5 /100 | #93 | Exceptional 23.6% |
| Hondurans | 99.5 /100 | #94 | Exceptional 23.6% |
| Cape Verdeans | 99.4 /100 | #95 | Exceptional 23.6% |
| Kiowa | 99.4 /100 | #96 | Exceptional 23.6% |
| Immigrants | Sudan | 99.4 /100 | #97 | Exceptional 23.6% |
Demographics Similar to Israelis by Wage/Income Gap
In terms of wage/income gap, the demographic groups most similar to Israelis are Immigrants from France (27.4%, a difference of 0.010%), Portuguese (27.4%, a difference of 0.080%), Cherokee (27.4%, a difference of 0.11%), Luxembourger (27.4%, a difference of 0.16%), and Slavic (27.4%, a difference of 0.20%).
| Demographics | Rating | Rank | Wage/Income Gap |
| Celtics | 2.8 /100 | #247 | Tragic 27.3% |
| Cypriots | 2.8 /100 | #248 | Tragic 27.3% |
| Carpatho Rusyns | 2.7 /100 | #249 | Tragic 27.3% |
| Immigrants | Czechoslovakia | 2.7 /100 | #250 | Tragic 27.3% |
| Immigrants | Norway | 2.5 /100 | #251 | Tragic 27.3% |
| Ukrainians | 2.4 /100 | #252 | Tragic 27.3% |
| Portuguese | 2.2 /100 | #253 | Tragic 27.4% |
| Israelis | 2.1 /100 | #254 | Tragic 27.4% |
| Immigrants | France | 2.1 /100 | #255 | Tragic 27.4% |
| Cherokee | 1.9 /100 | #256 | Tragic 27.4% |
| Luxembourgers | 1.9 /100 | #257 | Tragic 27.4% |
| Slavs | 1.8 /100 | #258 | Tragic 27.4% |
| Icelanders | 1.8 /100 | #259 | Tragic 27.5% |
| Tongans | 1.7 /100 | #260 | Tragic 27.5% |
| Immigrants | Germany | 1.5 /100 | #261 | Tragic 27.5% |