Guatemalan vs Immigrants from China 7th Grade
COMPARE
Guatemalan
Immigrants from China
7th Grade
7th Grade Comparison
Guatemalans
Immigrants from China
91.7%
7TH GRADE
0.0/ 100
METRIC RATING
341st/ 347
METRIC RANK
95.3%
7TH GRADE
0.7/ 100
METRIC RATING
256th/ 347
METRIC RANK
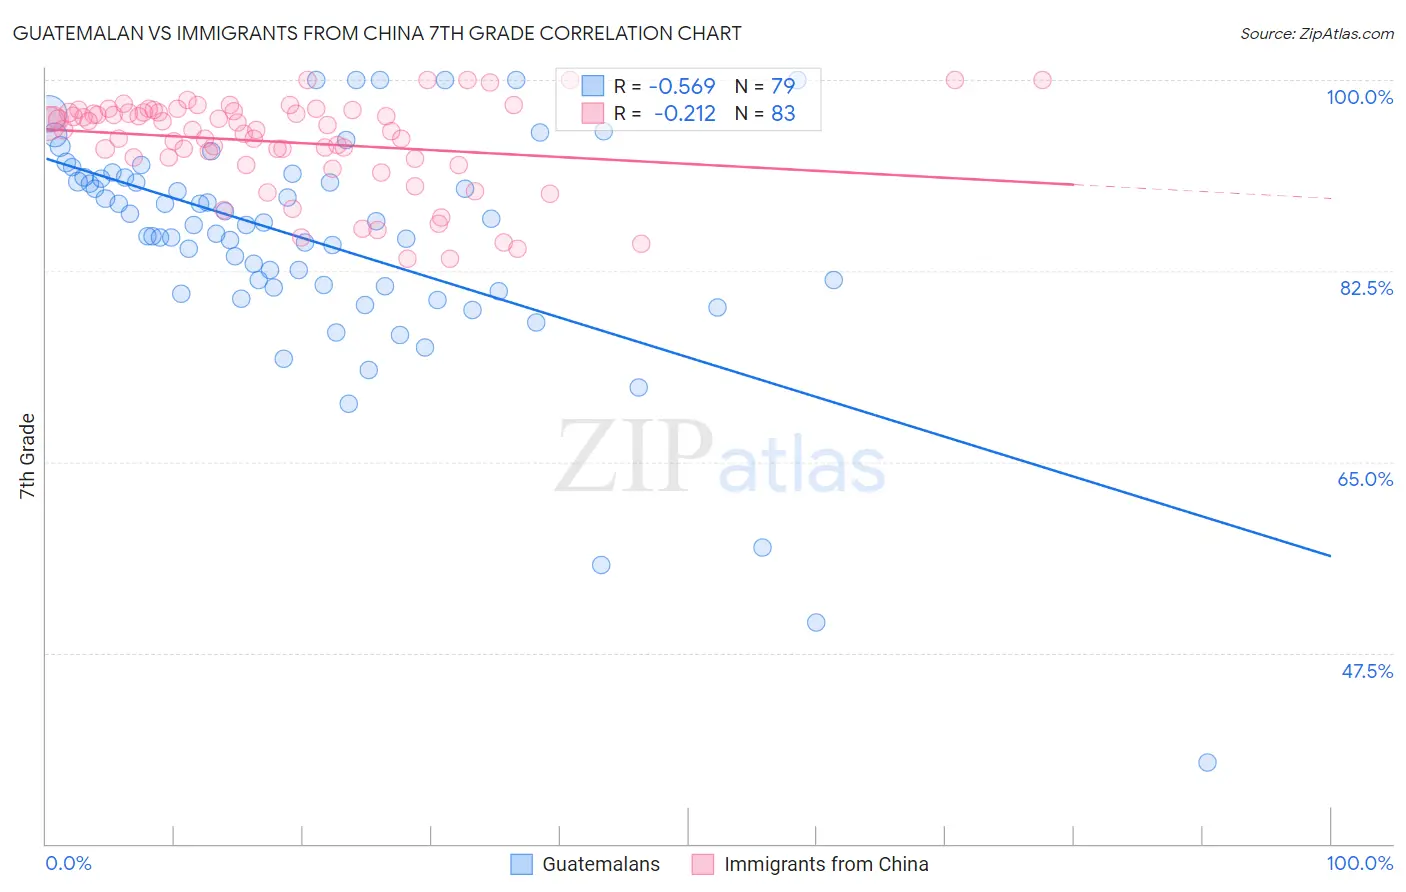
Guatemalan vs Immigrants from China 7th Grade Correlation Chart
The statistical analysis conducted on geographies consisting of 409,566,618 people shows a substantial negative correlation between the proportion of Guatemalans and percentage of population with at least 7th grade education in the United States with a correlation coefficient (R) of -0.569 and weighted average of 91.7%. Similarly, the statistical analysis conducted on geographies consisting of 457,082,957 people shows a weak negative correlation between the proportion of Immigrants from China and percentage of population with at least 7th grade education in the United States with a correlation coefficient (R) of -0.212 and weighted average of 95.3%, a difference of 3.9%.
7th Grade Correlation Summary
| Measurement | Guatemalan | Immigrants from China |
| Minimum | 37.5% | 83.6% |
| Maximum | 100.0% | 100.0% |
| Range | 62.5% | 16.4% |
| Mean | 85.1% | 94.3% |
| Median | 86.8% | 95.5% |
| Interquartile 25% (IQ1) | 81.0% | 92.8% |
| Interquartile 75% (IQ3) | 91.1% | 97.2% |
| Interquartile Range (IQR) | 10.1% | 4.4% |
| Standard Deviation (Sample) | 10.8% | 4.2% |
| Standard Deviation (Population) | 10.7% | 4.2% |
Similar Demographics by 7th Grade
Demographics Similar to Guatemalans by 7th Grade
In terms of 7th grade, the demographic groups most similar to Guatemalans are Yakama (91.7%, a difference of 0.020%), Mexican (91.9%, a difference of 0.21%), Salvadoran (91.5%, a difference of 0.27%), Immigrants from Guatemala (91.3%, a difference of 0.43%), and Central American (92.1%, a difference of 0.46%).
| Demographics | Rating | Rank | 7th Grade |
| Immigrants | Armenia | 0.0 /100 | #333 | Tragic 92.7% |
| Immigrants | Yemen | 0.0 /100 | #334 | Tragic 92.6% |
| Mexican American Indians | 0.0 /100 | #335 | Tragic 92.6% |
| Immigrants | Honduras | 0.0 /100 | #336 | Tragic 92.5% |
| Immigrants | Latin America | 0.0 /100 | #337 | Tragic 92.2% |
| Central Americans | 0.0 /100 | #338 | Tragic 92.1% |
| Mexicans | 0.0 /100 | #339 | Tragic 91.9% |
| Yakama | 0.0 /100 | #340 | Tragic 91.7% |
| Guatemalans | 0.0 /100 | #341 | Tragic 91.7% |
| Salvadorans | 0.0 /100 | #342 | Tragic 91.5% |
| Immigrants | Guatemala | 0.0 /100 | #343 | Tragic 91.3% |
| Immigrants | Central America | 0.0 /100 | #344 | Tragic 91.0% |
| Immigrants | El Salvador | 0.0 /100 | #345 | Tragic 90.9% |
| Immigrants | Mexico | 0.0 /100 | #346 | Tragic 90.7% |
| Spanish American Indians | 0.0 /100 | #347 | Tragic 90.3% |
Demographics Similar to Immigrants from China by 7th Grade
In terms of 7th grade, the demographic groups most similar to Immigrants from China are Immigrants from Congo (95.3%, a difference of 0.0%), Ghanaian (95.3%, a difference of 0.0%), Korean (95.3%, a difference of 0.010%), Colombian (95.3%, a difference of 0.020%), and Immigrants from Ethiopia (95.3%, a difference of 0.030%).
| Demographics | Rating | Rank | 7th Grade |
| Bolivians | 1.1 /100 | #249 | Tragic 95.4% |
| Immigrants | Cameroon | 0.9 /100 | #250 | Tragic 95.4% |
| Immigrants | Jamaica | 0.9 /100 | #251 | Tragic 95.4% |
| Immigrants | Ethiopia | 0.9 /100 | #252 | Tragic 95.3% |
| Somalis | 0.9 /100 | #253 | Tragic 95.3% |
| Colombians | 0.8 /100 | #254 | Tragic 95.3% |
| Koreans | 0.8 /100 | #255 | Tragic 95.3% |
| Immigrants | China | 0.7 /100 | #256 | Tragic 95.3% |
| Immigrants | Congo | 0.7 /100 | #257 | Tragic 95.3% |
| Ghanaians | 0.7 /100 | #258 | Tragic 95.3% |
| Immigrants | Costa Rica | 0.6 /100 | #259 | Tragic 95.3% |
| Afghans | 0.5 /100 | #260 | Tragic 95.3% |
| South Americans | 0.5 /100 | #261 | Tragic 95.2% |
| Immigrants | Somalia | 0.5 /100 | #262 | Tragic 95.2% |
| West Indians | 0.5 /100 | #263 | Tragic 95.2% |