Guatemalan vs Immigrants from Denmark Per Capita Income
COMPARE
Guatemalan
Immigrants from Denmark
Per Capita Income
Per Capita Income Comparison
Guatemalans
Immigrants from Denmark
$37,766
PER CAPITA INCOME
0.1/ 100
METRIC RATING
285th/ 347
METRIC RANK
$53,799
PER CAPITA INCOME
100.0/ 100
METRIC RATING
24th/ 347
METRIC RANK
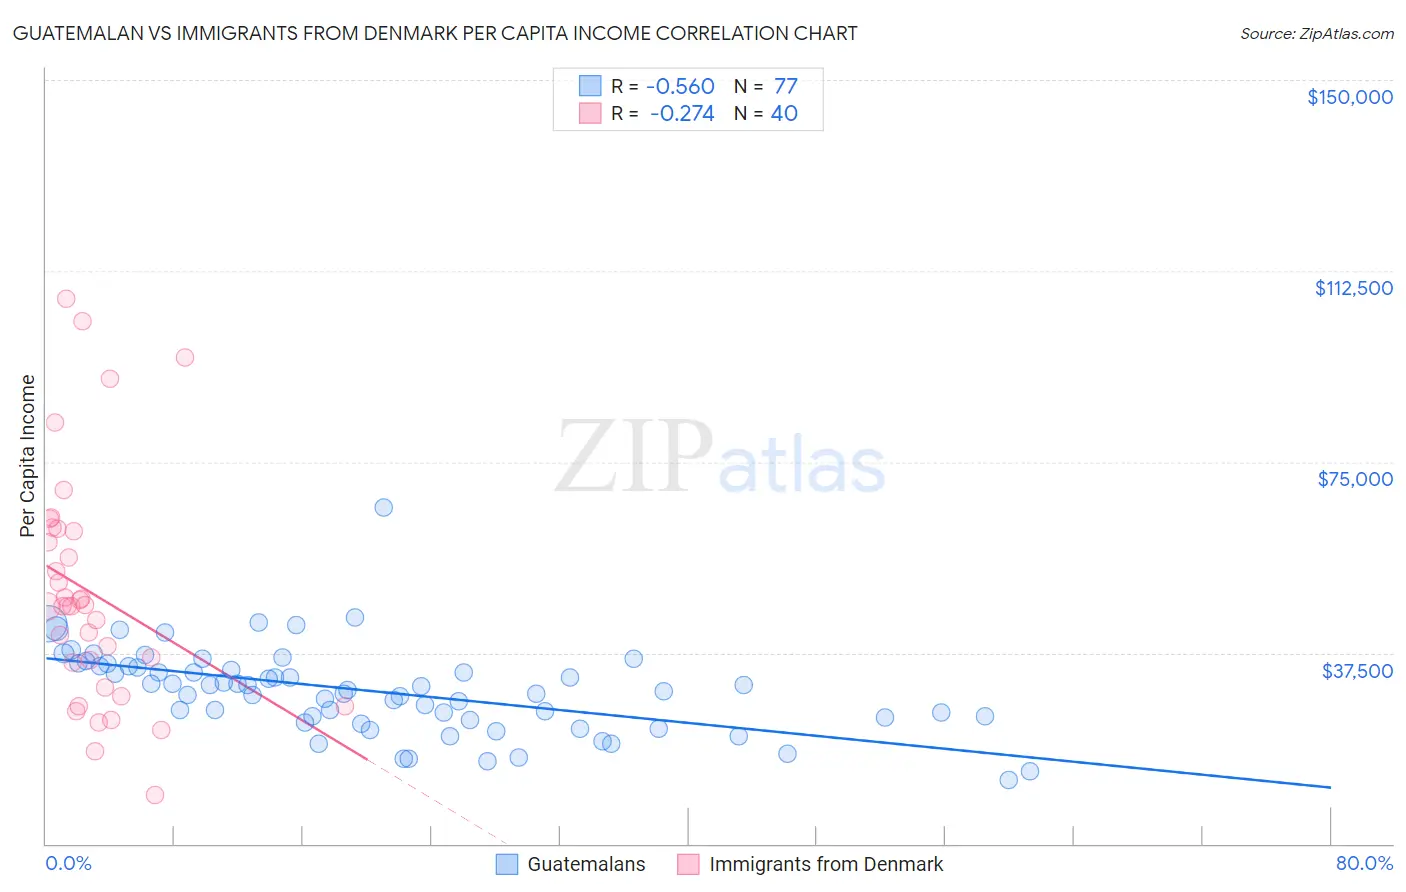
Guatemalan vs Immigrants from Denmark Per Capita Income Correlation Chart
The statistical analysis conducted on geographies consisting of 409,586,498 people shows a substantial negative correlation between the proportion of Guatemalans and per capita income in the United States with a correlation coefficient (R) of -0.560 and weighted average of $37,766. Similarly, the statistical analysis conducted on geographies consisting of 136,433,467 people shows a weak negative correlation between the proportion of Immigrants from Denmark and per capita income in the United States with a correlation coefficient (R) of -0.274 and weighted average of $53,799, a difference of 42.4%.
Per Capita Income Correlation Summary
| Measurement | Guatemalan | Immigrants from Denmark |
| Minimum | $12,606 | $9,511 |
| Maximum | $66,145 | $106,981 |
| Range | $53,539 | $97,470 |
| Mean | $29,994 | $49,281 |
| Median | $30,165 | $46,658 |
| Interquartile 25% (IQ1) | $24,578 | $33,062 |
| Interquartile 75% (IQ3) | $34,822 | $61,546 |
| Interquartile Range (IQR) | $10,244 | $28,484 |
| Standard Deviation (Sample) | $8,508 | $22,845 |
| Standard Deviation (Population) | $8,452 | $22,558 |
Similar Demographics by Per Capita Income
Demographics Similar to Guatemalans by Per Capita Income
In terms of per capita income, the demographic groups most similar to Guatemalans are African ($37,785, a difference of 0.050%), Central American Indian ($37,699, a difference of 0.18%), Dominican ($37,697, a difference of 0.19%), Blackfeet ($37,695, a difference of 0.19%), and Pennsylvania German ($37,842, a difference of 0.20%).
| Demographics | Rating | Rank | Per Capita Income |
| Immigrants | Nicaragua | 0.2 /100 | #278 | Tragic $38,065 |
| Colville | 0.2 /100 | #279 | Tragic $38,047 |
| Potawatomi | 0.2 /100 | #280 | Tragic $38,046 |
| Immigrants | Dominica | 0.2 /100 | #281 | Tragic $37,952 |
| Immigrants | Laos | 0.1 /100 | #282 | Tragic $37,857 |
| Pennsylvania Germans | 0.1 /100 | #283 | Tragic $37,842 |
| Africans | 0.1 /100 | #284 | Tragic $37,785 |
| Guatemalans | 0.1 /100 | #285 | Tragic $37,766 |
| Central American Indians | 0.1 /100 | #286 | Tragic $37,699 |
| Dominicans | 0.1 /100 | #287 | Tragic $37,697 |
| Blackfeet | 0.1 /100 | #288 | Tragic $37,695 |
| U.S. Virgin Islanders | 0.1 /100 | #289 | Tragic $37,589 |
| Immigrants | Guatemala | 0.1 /100 | #290 | Tragic $37,550 |
| Cajuns | 0.1 /100 | #291 | Tragic $37,527 |
| Immigrants | Micronesia | 0.1 /100 | #292 | Tragic $37,464 |
Demographics Similar to Immigrants from Denmark by Per Capita Income
In terms of per capita income, the demographic groups most similar to Immigrants from Denmark are Immigrants from Eastern Asia ($53,806, a difference of 0.010%), Indian (Asian) ($53,874, a difference of 0.14%), Immigrants from Northern Europe ($54,159, a difference of 0.67%), Soviet Union ($54,202, a difference of 0.75%), and Immigrants from Japan ($53,359, a difference of 0.82%).
| Demographics | Rating | Rank | Per Capita Income |
| Immigrants | France | 100.0 /100 | #17 | Exceptional $54,557 |
| Thais | 100.0 /100 | #18 | Exceptional $54,307 |
| Immigrants | China | 100.0 /100 | #19 | Exceptional $54,264 |
| Soviet Union | 100.0 /100 | #20 | Exceptional $54,202 |
| Immigrants | Northern Europe | 100.0 /100 | #21 | Exceptional $54,159 |
| Indians (Asian) | 100.0 /100 | #22 | Exceptional $53,874 |
| Immigrants | Eastern Asia | 100.0 /100 | #23 | Exceptional $53,806 |
| Immigrants | Denmark | 100.0 /100 | #24 | Exceptional $53,799 |
| Immigrants | Japan | 100.0 /100 | #25 | Exceptional $53,359 |
| Russians | 100.0 /100 | #26 | Exceptional $53,154 |
| Immigrants | South Central Asia | 100.0 /100 | #27 | Exceptional $52,660 |
| Latvians | 100.0 /100 | #28 | Exceptional $52,649 |
| Israelis | 100.0 /100 | #29 | Exceptional $52,596 |
| Immigrants | Austria | 100.0 /100 | #30 | Exceptional $52,503 |
| Turks | 100.0 /100 | #31 | Exceptional $52,391 |