Guatemalan vs Dutch West Indian Per Capita Income
COMPARE
Guatemalan
Dutch West Indian
Per Capita Income
Per Capita Income Comparison
Guatemalans
Dutch West Indians
$37,766
PER CAPITA INCOME
0.1/ 100
METRIC RATING
285th/ 347
METRIC RANK
$35,922
PER CAPITA INCOME
0.0/ 100
METRIC RATING
317th/ 347
METRIC RANK
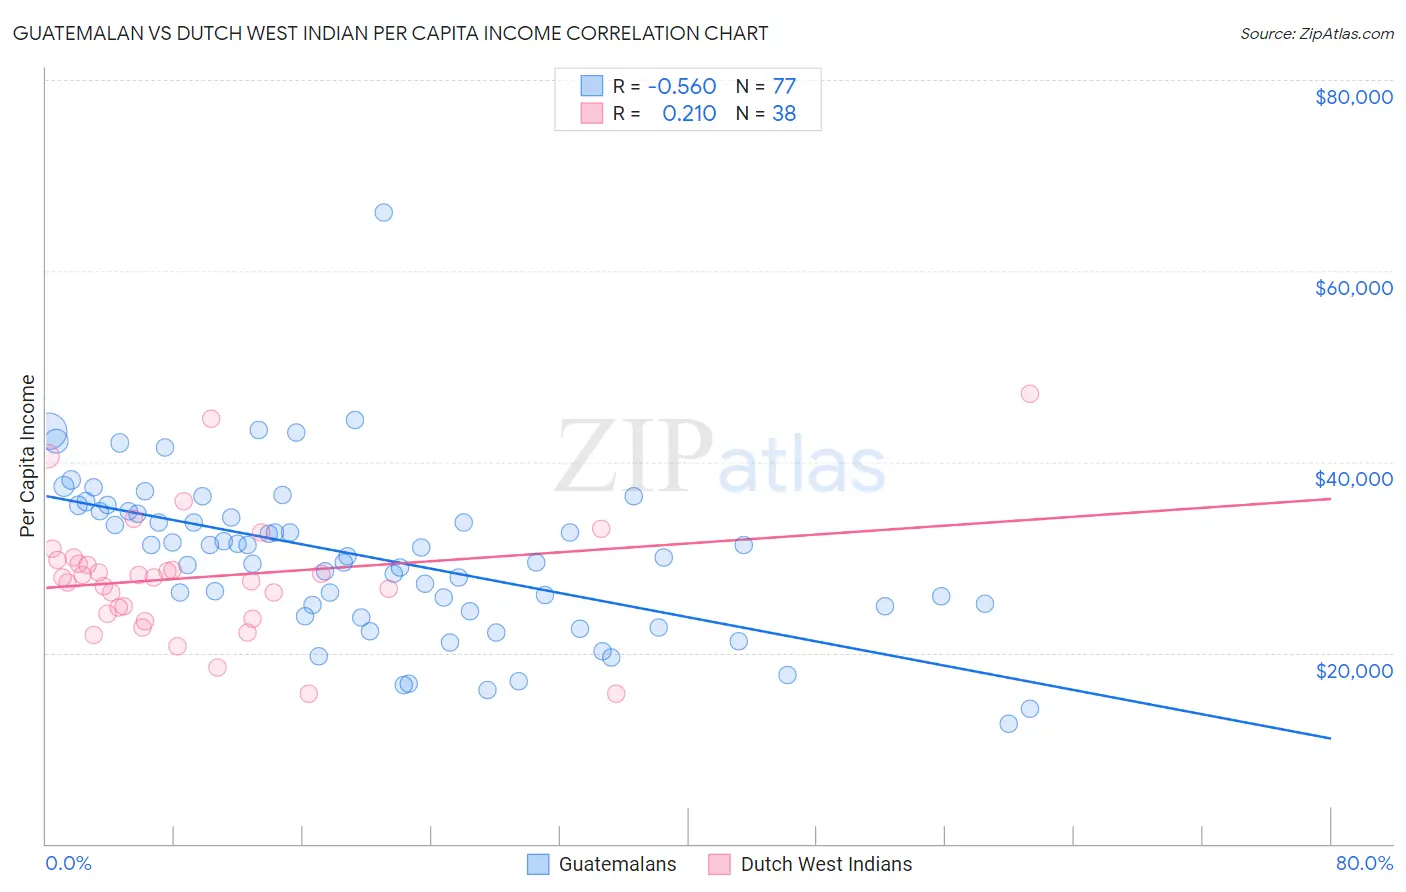
Guatemalan vs Dutch West Indian Per Capita Income Correlation Chart
The statistical analysis conducted on geographies consisting of 409,586,498 people shows a substantial negative correlation between the proportion of Guatemalans and per capita income in the United States with a correlation coefficient (R) of -0.560 and weighted average of $37,766. Similarly, the statistical analysis conducted on geographies consisting of 85,776,103 people shows a weak positive correlation between the proportion of Dutch West Indians and per capita income in the United States with a correlation coefficient (R) of 0.210 and weighted average of $35,922, a difference of 5.1%.
Per Capita Income Correlation Summary
| Measurement | Guatemalan | Dutch West Indian |
| Minimum | $12,606 | $15,696 |
| Maximum | $66,145 | $47,132 |
| Range | $53,539 | $31,436 |
| Mean | $29,994 | $27,952 |
| Median | $30,165 | $27,901 |
| Interquartile 25% (IQ1) | $24,578 | $24,038 |
| Interquartile 75% (IQ3) | $34,822 | $29,729 |
| Interquartile Range (IQR) | $10,244 | $5,691 |
| Standard Deviation (Sample) | $8,508 | $6,566 |
| Standard Deviation (Population) | $8,452 | $6,479 |
Similar Demographics by Per Capita Income
Demographics Similar to Guatemalans by Per Capita Income
In terms of per capita income, the demographic groups most similar to Guatemalans are African ($37,785, a difference of 0.050%), Central American Indian ($37,699, a difference of 0.18%), Dominican ($37,697, a difference of 0.19%), Blackfeet ($37,695, a difference of 0.19%), and Pennsylvania German ($37,842, a difference of 0.20%).
| Demographics | Rating | Rank | Per Capita Income |
| Immigrants | Nicaragua | 0.2 /100 | #278 | Tragic $38,065 |
| Colville | 0.2 /100 | #279 | Tragic $38,047 |
| Potawatomi | 0.2 /100 | #280 | Tragic $38,046 |
| Immigrants | Dominica | 0.2 /100 | #281 | Tragic $37,952 |
| Immigrants | Laos | 0.1 /100 | #282 | Tragic $37,857 |
| Pennsylvania Germans | 0.1 /100 | #283 | Tragic $37,842 |
| Africans | 0.1 /100 | #284 | Tragic $37,785 |
| Guatemalans | 0.1 /100 | #285 | Tragic $37,766 |
| Central American Indians | 0.1 /100 | #286 | Tragic $37,699 |
| Dominicans | 0.1 /100 | #287 | Tragic $37,697 |
| Blackfeet | 0.1 /100 | #288 | Tragic $37,695 |
| U.S. Virgin Islanders | 0.1 /100 | #289 | Tragic $37,589 |
| Immigrants | Guatemala | 0.1 /100 | #290 | Tragic $37,550 |
| Cajuns | 0.1 /100 | #291 | Tragic $37,527 |
| Immigrants | Micronesia | 0.1 /100 | #292 | Tragic $37,464 |
Demographics Similar to Dutch West Indians by Per Capita Income
In terms of per capita income, the demographic groups most similar to Dutch West Indians are Bangladeshi ($35,897, a difference of 0.070%), Choctaw ($35,999, a difference of 0.21%), Yaqui ($36,112, a difference of 0.53%), Immigrants from Congo ($35,720, a difference of 0.57%), and Hispanic or Latino ($35,688, a difference of 0.66%).
| Demographics | Rating | Rank | Per Capita Income |
| Ute | 0.0 /100 | #310 | Tragic $36,651 |
| Chippewa | 0.0 /100 | #311 | Tragic $36,631 |
| Chickasaw | 0.0 /100 | #312 | Tragic $36,475 |
| Bahamians | 0.0 /100 | #313 | Tragic $36,427 |
| Seminole | 0.0 /100 | #314 | Tragic $36,180 |
| Yaqui | 0.0 /100 | #315 | Tragic $36,112 |
| Choctaw | 0.0 /100 | #316 | Tragic $35,999 |
| Dutch West Indians | 0.0 /100 | #317 | Tragic $35,922 |
| Bangladeshis | 0.0 /100 | #318 | Tragic $35,897 |
| Immigrants | Congo | 0.0 /100 | #319 | Tragic $35,720 |
| Hispanics or Latinos | 0.0 /100 | #320 | Tragic $35,688 |
| Blacks/African Americans | 0.0 /100 | #321 | Tragic $35,564 |
| Creek | 0.0 /100 | #322 | Tragic $35,546 |
| Cheyenne | 0.0 /100 | #323 | Tragic $35,276 |
| Kiowa | 0.0 /100 | #324 | Tragic $35,102 |