Guatemalan vs Immigrants from France Per Capita Income

COMPARE

Guatemalan
Race
Ancestry
AfghanAfricanAlaska NativeAlaskan AthabascanAlbanianAleutAlsatianAmericanApacheArabArapahoArgentineanArmenianAssyrian/Chaldean/SyriacAustralianAustrianBahamianBangladeshiBarbadianBasqueBelgianBelizeanBermudanBhutaneseBlackfeetBolivianBrazilianBritishBritish West IndianBulgarianBurmeseCajunCambodianCanadianCape VerdeanCarpatho RusynCelticCentral AmericanCentral American IndianCherokeeCheyenneChickasawChileanChineseChippewaChoctawColombianColvilleComancheCosta RicanCreeCreekCroatianCrowCubanCypriotCzechCzechoslovakianDanishDelawareDominicanDutchDutch West IndianEastern EuropeanEcuadorianEgyptianEnglishEstonianEthiopianEuropeanFijianFilipinoFinnishFrenchFrench American IndianFrench CanadianGermanGerman RussianGhanaianGreekGuamanian/ChamorroGuatemalanGuyaneseHaitianHmongHonduranHopiHoumaHungarianIcelanderIndian (Asian)IndonesianInupiatIranianIraqiIrishIroquoisIsraeliItalianJamaicanJapaneseJordanianKenyanKiowaKoreanLaotianLatvianLebaneseLiberianLithuanianLumbeeLuxembourgerMacedonianMalaysianMalteseMarshalleseMenomineeMexicanMexican American IndianMongolianMoroccanNative HawaiianNavajoNepaleseNew ZealanderNicaraguanNigerianNorthern EuropeanNorwegianOkinawanOsageOttawaPaiutePakistaniPalestinianPanamanianParaguayanPennsylvania GermanPeruvianPimaPolishPortuguesePotawatomiPuebloPuerto RicanPuget Sound SalishRomanianRussianSalvadoranSamoanScandinavianScotch-IrishScottishSeminoleSenegaleseSerbianShoshoneSierra LeoneanSiouxSlavicSlovakSloveneSomaliSouth AfricanSouth AmericanSouth American IndianSoviet UnionSpaniardSpanishSpanish AmericanSpanish American IndianSri LankanSubsaharan AfricanSudaneseSwedishSwissSyrianTaiwaneseThaiTlingit-HaidaTohono O'OdhamTonganTrinidadian and TobagonianTsimshianTurkishU.S. Virgin IslanderUgandanUkrainianUruguayanUteVenezuelanVietnameseWelshWest IndianYakamaYaquiYugoslavianYumanYup'ikZimbabwean
Immigration
NonimmigrantsImmigrantsAfghanistanAfricaAlbaniaArgentinaArmeniaAsiaAustraliaAustriaBahamasBangladeshBarbadosBelarusBelgiumBelizeBoliviaBosnia and HerzegovinaBrazilBulgariaBurma/MyanmarCabo VerdeCambodiaCameroonCanadaCaribbeanCentral AmericaChileChinaColombiaCongoCosta RicaCroatiaCubaCzechoslovakiaDenmarkDominicaDominican RepublicEastern AfricaEastern AsiaEastern EuropeEcuadorEgyptEl SalvadorEnglandEritreaEthiopiaEuropeFijiGermanyGhanaGreeceGrenadaGuatemalaGuyanaHaitiHondurasHong KongHungaryIndiaIndonesiaIranIraqIrelandIsraelItalyJamaicaJapanJordanKazakhstanKenyaKoreaKuwaitLaosLatin AmericaLatviaLebanonLiberiaLithuaniaMalaysiaMexicoMicronesiaMiddle AfricaMoldovaMoroccoNepalNetherlandsNicaraguaNigeriaNorth AmericaNorth MacedoniaNorthern AfricaNorthern EuropeNorwayOceaniaPakistanPanamaPeruPhilippinesPolandPortugalRomaniaRussiaSaudi ArabiaScotlandSenegalSerbiaSierra LeoneSingaporeSomaliaSouth AfricaSouth AmericaSouth Central AsiaSouth Eastern AsiaSouthern EuropeSpainSri LankaSt. Vincent and the GrenadinesSudanSwedenSwitzerlandSyriaTaiwanThailandTrinidad and TobagoTurkeyUgandaUkraineUruguayUzbekistanVenezuelaVietnamWest IndiesWestern AfricaWestern AsiaWestern EuropeYemenZaireZimbabweAzores
Immigrants from France
Race
Ancestry
AfghanAfricanAlaska NativeAlaskan AthabascanAlbanianAleutAlsatianAmericanApacheArabArapahoArgentineanArmenianAssyrian/Chaldean/SyriacAustralianAustrianBahamianBangladeshiBarbadianBasqueBelgianBelizeanBermudanBhutaneseBlackfeetBolivianBrazilianBritishBritish West IndianBulgarianBurmeseCajunCambodianCanadianCape VerdeanCarpatho RusynCelticCentral AmericanCentral American IndianCherokeeCheyenneChickasawChileanChineseChippewaChoctawColombianColvilleComancheCosta RicanCreeCreekCroatianCrowCubanCypriotCzechCzechoslovakianDanishDelawareDominicanDutchDutch West IndianEastern EuropeanEcuadorianEgyptianEnglishEstonianEthiopianEuropeanFijianFilipinoFinnishFrenchFrench American IndianFrench CanadianGermanGerman RussianGhanaianGreekGuamanian/ChamorroGuyaneseHaitianHmongHonduranHopiHoumaHungarianIcelanderIndian (Asian)IndonesianInupiatIranianIraqiIrishIroquoisIsraeliItalianJamaicanJapaneseJordanianKenyanKiowaKoreanLaotianLatvianLebaneseLiberianLithuanianLumbeeLuxembourgerMacedonianMalaysianMalteseMarshalleseMenomineeMexicanMexican American IndianMongolianMoroccanNative HawaiianNavajoNepaleseNew ZealanderNicaraguanNigerianNorthern EuropeanNorwegianOkinawanOsageOttawaPaiutePakistaniPalestinianPanamanianParaguayanPennsylvania GermanPeruvianPimaPolishPortuguesePotawatomiPuebloPuerto RicanPuget Sound SalishRomanianRussianSalvadoranSamoanScandinavianScotch-IrishScottishSeminoleSenegaleseSerbianShoshoneSierra LeoneanSiouxSlavicSlovakSloveneSomaliSouth AfricanSouth AmericanSouth American IndianSoviet UnionSpaniardSpanishSpanish AmericanSpanish American IndianSri LankanSubsaharan AfricanSudaneseSwedishSwissSyrianTaiwaneseThaiTlingit-HaidaTohono O'OdhamTonganTrinidadian and TobagonianTsimshianTurkishU.S. Virgin IslanderUgandanUkrainianUruguayanUteVenezuelanVietnameseWelshWest IndianYakamaYaquiYugoslavianYumanYup'ikZimbabwean
Immigration
NonimmigrantsImmigrantsAfghanistanAfricaAlbaniaArgentinaArmeniaAsiaAustraliaAustriaBahamasBangladeshBarbadosBelarusBelgiumBelizeBoliviaBosnia and HerzegovinaBrazilBulgariaBurma/MyanmarCabo VerdeCambodiaCameroonCanadaCaribbeanCentral AmericaChileChinaColombiaCongoCosta RicaCroatiaCubaCzechoslovakiaDenmarkDominicaDominican RepublicEastern AfricaEastern AsiaEastern EuropeEcuadorEgyptEl SalvadorEnglandEritreaEthiopiaEuropeFijiFranceGermanyGhanaGreeceGrenadaGuatemalaGuyanaHaitiHondurasHong KongHungaryIndiaIndonesiaIranIraqIrelandIsraelItalyJamaicaJapanJordanKazakhstanKenyaKoreaKuwaitLaosLatin AmericaLatviaLebanonLiberiaLithuaniaMalaysiaMexicoMicronesiaMiddle AfricaMoldovaMoroccoNepalNetherlandsNicaraguaNigeriaNorth AmericaNorth MacedoniaNorthern AfricaNorthern EuropeNorwayOceaniaPakistanPanamaPeruPhilippinesPolandPortugalRomaniaRussiaSaudi ArabiaScotlandSenegalSerbiaSierra LeoneSingaporeSomaliaSouth AfricaSouth AmericaSouth Central AsiaSouth Eastern AsiaSouthern EuropeSpainSri LankaSt. Vincent and the GrenadinesSudanSwedenSwitzerlandSyriaTaiwanThailandTrinidad and TobagoTurkeyUgandaUkraineUruguayUzbekistanVenezuelaVietnamWest IndiesWestern AfricaWestern AsiaWestern EuropeYemenZaireZimbabweAzores
Per Capita Income
Income
Poverty
Unemployment
Labor Participation
Family Structure
Vehicle Availability
Education Level
Disability

Per Capita Income Comparison

Guatemalans

Immigrants from France

Tragic
Exceptional
$37,766
PER CAPITA INCOME
0.1/ 100
METRIC RATING
285th/ 347
METRIC RANK
$54,557
PER CAPITA INCOME
100.0/ 100
METRIC RATING
17th/ 347
METRIC RANK

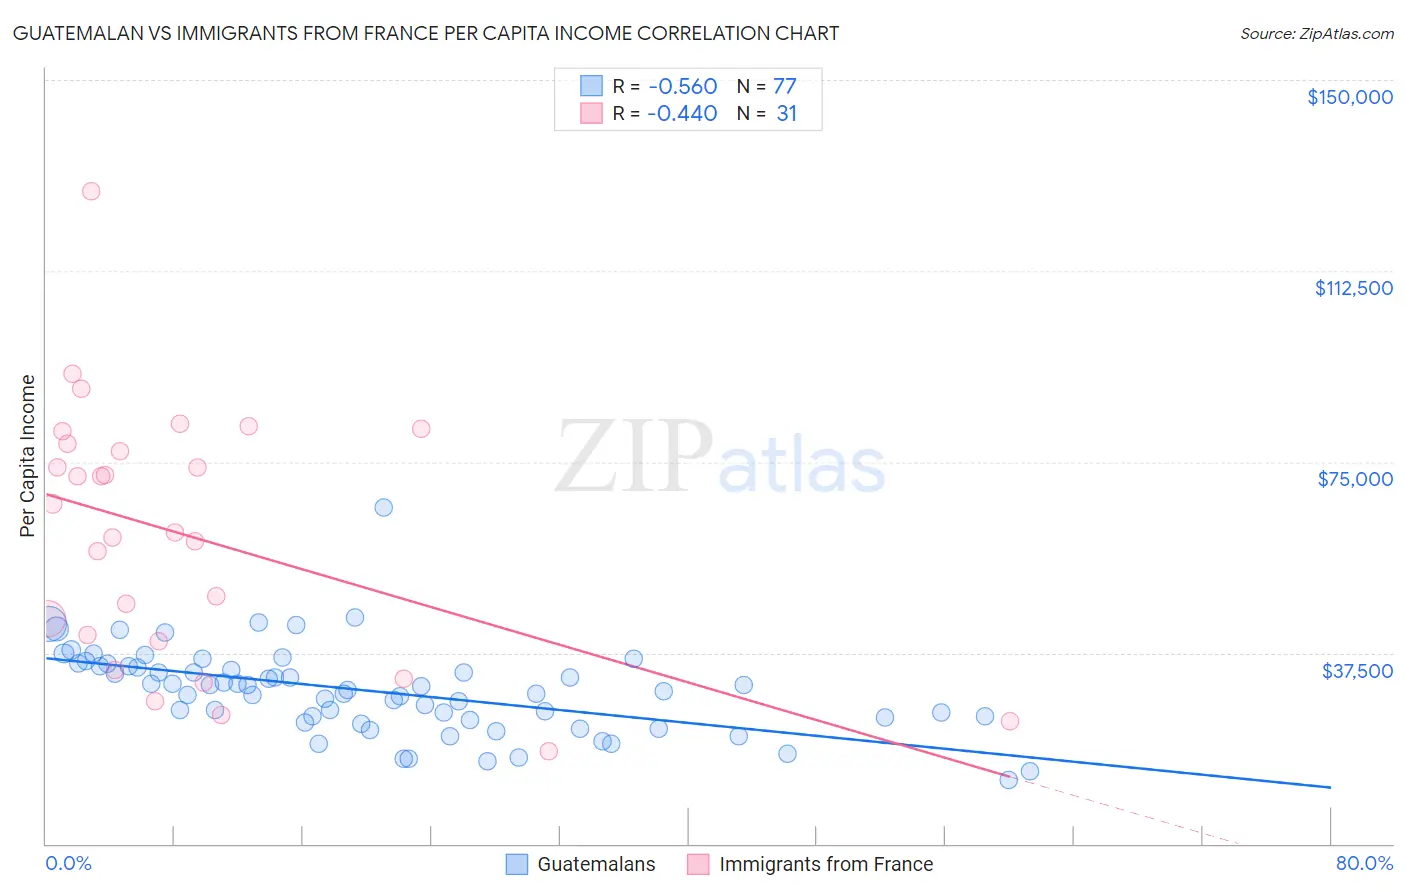
Guatemalan vs Immigrants from France Per Capita Income Correlation Chart

The statistical analysis conducted on geographies consisting of 409,586,498 people shows a substantial negative correlation between the proportion of Guatemalans and per capita income in the United States with a correlation coefficient (R) of -0.560 and weighted average of $37,766. Similarly, the statistical analysis conducted on geographies consisting of 287,921,754 people shows a moderate negative correlation between the proportion of Immigrants from France and per capita income in the United States with a correlation coefficient (R) of -0.440 and weighted average of $54,557, a difference of 44.5%.
Guatemalan vs Immigrants from France Per Capita Income

Per Capita Income Correlation Summary

MeasurementGuatemalanImmigrants from France
Minimum$12,606$18,269
Maximum$66,145$128,207
Range$53,539$109,938
Mean$29,994$60,537
Median$30,165$61,063
Interquartile 25% (IQ1)$24,578$39,770
Interquartile 75% (IQ3)$34,822$78,483
Interquartile Range (IQR)$10,244$38,713
Standard Deviation (Sample)$8,508$25,024
Standard Deviation (Population)$8,452$24,617

Similar Demographics by Per Capita Income

Demographics Similar to Guatemalans by Per Capita Income

In terms of per capita income, the demographic groups most similar to Guatemalans are African ($37,785, a difference of 0.050%), Central American Indian ($37,699, a difference of 0.18%), Dominican ($37,697, a difference of 0.19%), Blackfeet ($37,695, a difference of 0.19%), and Pennsylvania German ($37,842, a difference of 0.20%).
DemographicsRating | RankPer Capita Income
Immigrants | Nicaragua
0.2
/100
|
#278
Tragic
$38,065
Colville
0.2
/100
|
#279
Tragic
$38,047
Potawatomi
0.2
/100
|
#280
Tragic
$38,046
Immigrants | Dominica
0.2
/100
|
#281
Tragic
$37,952
Immigrants | Laos
0.1
/100
|
#282
Tragic
$37,857
Pennsylvania Germans
0.1
/100
|
#283
Tragic
$37,842
Africans
0.1
/100
|
#284
Tragic
$37,785
Guatemalans
0.1
/100
|
#285
Tragic
$37,766
Central American Indians
0.1
/100
|
#286
Tragic
$37,699
Dominicans
0.1
/100
|
#287
Tragic
$37,697
Blackfeet
0.1
/100
|
#288
Tragic
$37,695
U.S. Virgin Islanders
0.1
/100
|
#289
Tragic
$37,589
Immigrants | Guatemala
0.1
/100
|
#290
Tragic
$37,550
Cajuns
0.1
/100
|
#291
Tragic
$37,527
Immigrants | Micronesia
0.1
/100
|
#292
Tragic
$37,464

Demographics Similar to Immigrants from France by Per Capita Income

In terms of per capita income, the demographic groups most similar to Immigrants from France are Thai ($54,307, a difference of 0.46%), Immigrants from China ($54,264, a difference of 0.54%), Immigrants from Switzerland ($54,866, a difference of 0.57%), Cypriot ($54,899, a difference of 0.63%), and Soviet Union ($54,202, a difference of 0.65%).
DemographicsRating | RankPer Capita Income
Okinawans
100.0
/100
|
#10
Exceptional
$55,817
Eastern Europeans
100.0
/100
|
#11
Exceptional
$55,780
Immigrants | Sweden
100.0
/100
|
#12
Exceptional
$55,582
Immigrants | India
100.0
/100
|
#13
Exceptional
$55,268
Immigrants | Belgium
100.0
/100
|
#14
Exceptional
$55,082
Cypriots
100.0
/100
|
#15
Exceptional
$54,899
Immigrants | Switzerland
100.0
/100
|
#16
Exceptional
$54,866
Immigrants | France
100.0
/100
|
#17
Exceptional
$54,557
Thais
100.0
/100
|
#18
Exceptional
$54,307
Immigrants | China
100.0
/100
|
#19
Exceptional
$54,264
Soviet Union
100.0
/100
|
#20
Exceptional
$54,202
Immigrants | Northern Europe
100.0
/100
|
#21
Exceptional
$54,159
Indians (Asian)
100.0
/100
|
#22
Exceptional
$53,874
Immigrants | Eastern Asia
100.0
/100
|
#23
Exceptional
$53,806
Immigrants | Denmark
100.0
/100
|
#24
Exceptional
$53,799