Guatemalan vs Jamaican Per Capita Income
COMPARE
Guatemalan
Jamaican
Per Capita Income
Per Capita Income Comparison
Guatemalans
Jamaicans
$37,766
PER CAPITA INCOME
0.1/ 100
METRIC RATING
285th/ 347
METRIC RANK
$39,231
PER CAPITA INCOME
0.7/ 100
METRIC RATING
258th/ 347
METRIC RANK
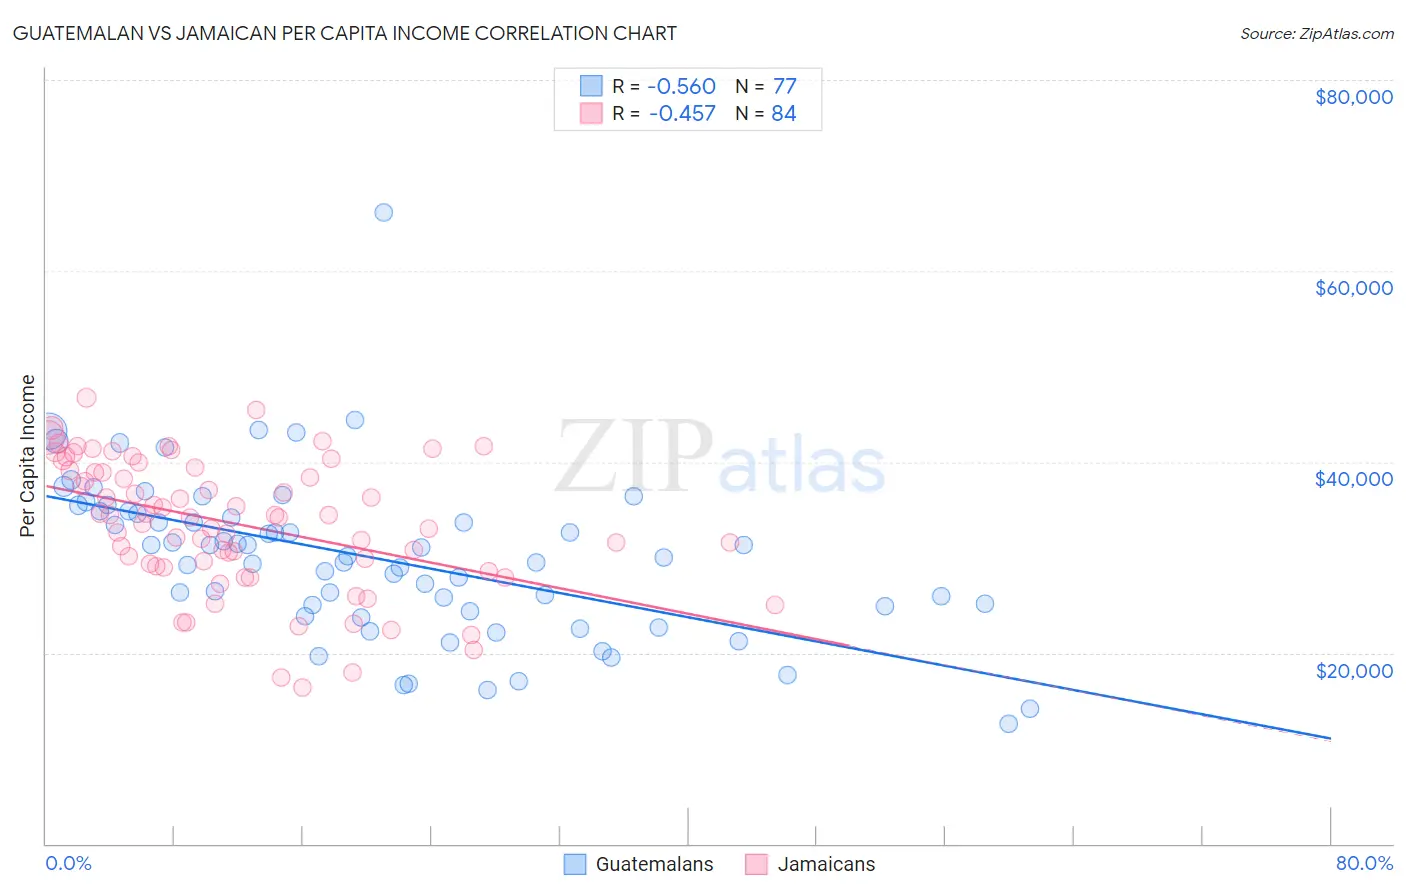
Guatemalan vs Jamaican Per Capita Income Correlation Chart
The statistical analysis conducted on geographies consisting of 409,586,498 people shows a substantial negative correlation between the proportion of Guatemalans and per capita income in the United States with a correlation coefficient (R) of -0.560 and weighted average of $37,766. Similarly, the statistical analysis conducted on geographies consisting of 368,110,686 people shows a moderate negative correlation between the proportion of Jamaicans and per capita income in the United States with a correlation coefficient (R) of -0.457 and weighted average of $39,231, a difference of 3.9%.
Per Capita Income Correlation Summary
| Measurement | Guatemalan | Jamaican |
| Minimum | $12,606 | $16,350 |
| Maximum | $66,145 | $46,707 |
| Range | $53,539 | $30,357 |
| Mean | $29,994 | $33,502 |
| Median | $30,165 | $34,287 |
| Interquartile 25% (IQ1) | $24,578 | $29,169 |
| Interquartile 75% (IQ3) | $34,822 | $39,281 |
| Interquartile Range (IQR) | $10,244 | $10,112 |
| Standard Deviation (Sample) | $8,508 | $6,895 |
| Standard Deviation (Population) | $8,452 | $6,854 |
Similar Demographics by Per Capita Income
Demographics Similar to Guatemalans by Per Capita Income
In terms of per capita income, the demographic groups most similar to Guatemalans are African ($37,785, a difference of 0.050%), Central American Indian ($37,699, a difference of 0.18%), Dominican ($37,697, a difference of 0.19%), Blackfeet ($37,695, a difference of 0.19%), and Pennsylvania German ($37,842, a difference of 0.20%).
| Demographics | Rating | Rank | Per Capita Income |
| Immigrants | Nicaragua | 0.2 /100 | #278 | Tragic $38,065 |
| Colville | 0.2 /100 | #279 | Tragic $38,047 |
| Potawatomi | 0.2 /100 | #280 | Tragic $38,046 |
| Immigrants | Dominica | 0.2 /100 | #281 | Tragic $37,952 |
| Immigrants | Laos | 0.1 /100 | #282 | Tragic $37,857 |
| Pennsylvania Germans | 0.1 /100 | #283 | Tragic $37,842 |
| Africans | 0.1 /100 | #284 | Tragic $37,785 |
| Guatemalans | 0.1 /100 | #285 | Tragic $37,766 |
| Central American Indians | 0.1 /100 | #286 | Tragic $37,699 |
| Dominicans | 0.1 /100 | #287 | Tragic $37,697 |
| Blackfeet | 0.1 /100 | #288 | Tragic $37,695 |
| U.S. Virgin Islanders | 0.1 /100 | #289 | Tragic $37,589 |
| Immigrants | Guatemala | 0.1 /100 | #290 | Tragic $37,550 |
| Cajuns | 0.1 /100 | #291 | Tragic $37,527 |
| Immigrants | Micronesia | 0.1 /100 | #292 | Tragic $37,464 |
Demographics Similar to Jamaicans by Per Capita Income
In terms of per capita income, the demographic groups most similar to Jamaicans are Malaysian ($39,194, a difference of 0.090%), Alaskan Athabascan ($39,163, a difference of 0.17%), Marshallese ($39,108, a difference of 0.31%), Iroquois ($39,104, a difference of 0.33%), and Belizean ($39,097, a difference of 0.34%).
| Demographics | Rating | Rank | Per Capita Income |
| Samoans | 1.3 /100 | #251 | Tragic $39,826 |
| Immigrants | Azores | 1.0 /100 | #252 | Tragic $39,608 |
| Osage | 1.0 /100 | #253 | Tragic $39,568 |
| Alaska Natives | 1.0 /100 | #254 | Tragic $39,558 |
| Immigrants | Middle Africa | 1.0 /100 | #255 | Tragic $39,529 |
| Hawaiians | 0.8 /100 | #256 | Tragic $39,403 |
| Nicaraguans | 0.8 /100 | #257 | Tragic $39,372 |
| Jamaicans | 0.7 /100 | #258 | Tragic $39,231 |
| Malaysians | 0.7 /100 | #259 | Tragic $39,194 |
| Alaskan Athabascans | 0.6 /100 | #260 | Tragic $39,163 |
| Marshallese | 0.6 /100 | #261 | Tragic $39,108 |
| Iroquois | 0.6 /100 | #262 | Tragic $39,104 |
| Belizeans | 0.6 /100 | #263 | Tragic $39,097 |
| Americans | 0.6 /100 | #264 | Tragic $39,039 |
| Spanish Americans | 0.5 /100 | #265 | Tragic $39,012 |