Guatemalan vs Immigrants from Uruguay Per Capita Income
COMPARE
Guatemalan
Immigrants from Uruguay
Per Capita Income
Per Capita Income Comparison
Guatemalans
Immigrants from Uruguay
$37,766
PER CAPITA INCOME
0.1/ 100
METRIC RATING
285th/ 347
METRIC RANK
$43,997
PER CAPITA INCOME
59.3/ 100
METRIC RATING
166th/ 347
METRIC RANK
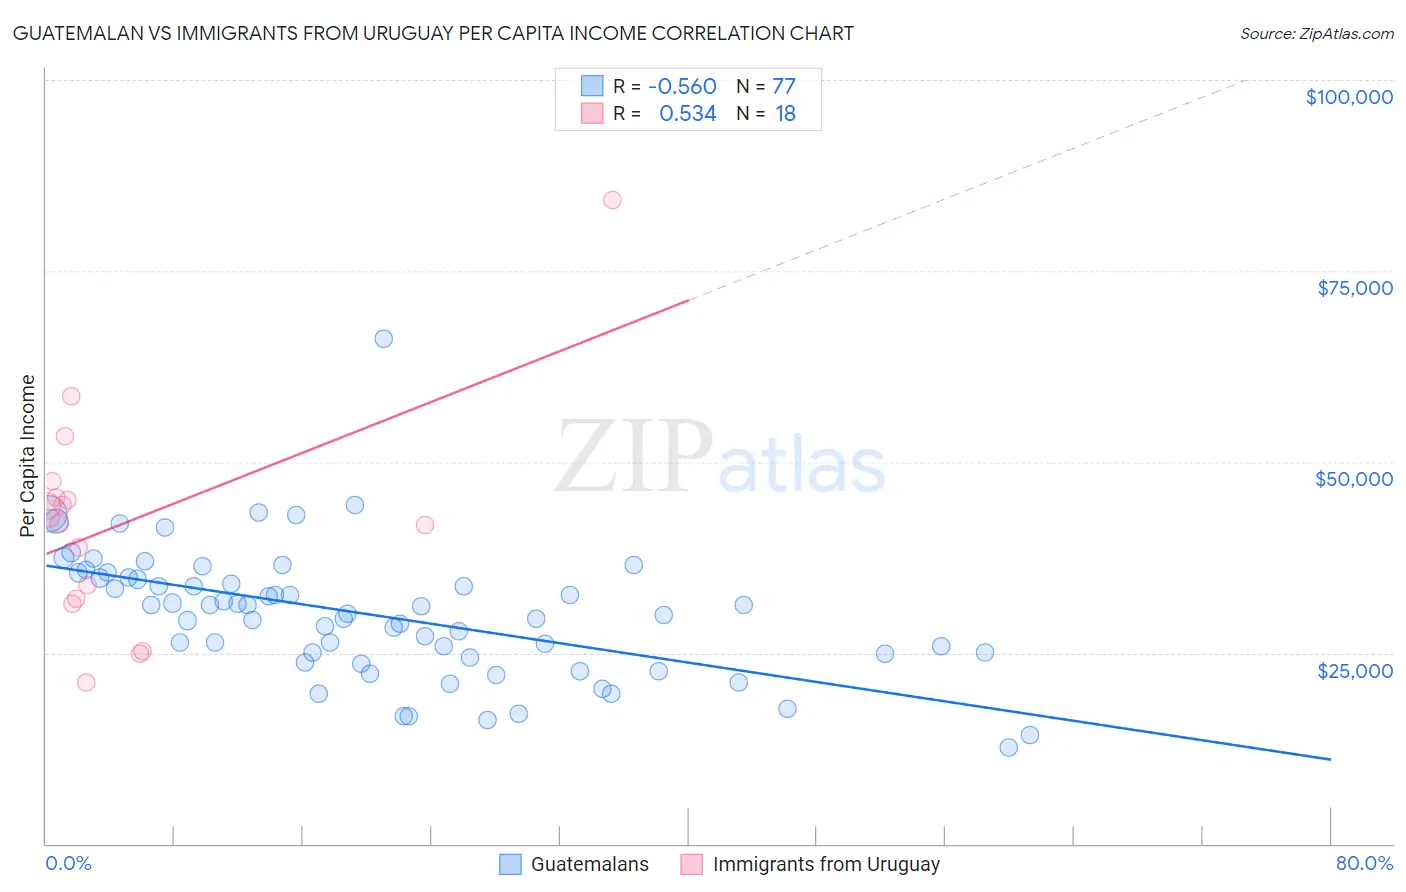
Guatemalan vs Immigrants from Uruguay Per Capita Income Correlation Chart
The statistical analysis conducted on geographies consisting of 409,586,498 people shows a substantial negative correlation between the proportion of Guatemalans and per capita income in the United States with a correlation coefficient (R) of -0.560 and weighted average of $37,766. Similarly, the statistical analysis conducted on geographies consisting of 133,259,667 people shows a substantial positive correlation between the proportion of Immigrants from Uruguay and per capita income in the United States with a correlation coefficient (R) of 0.534 and weighted average of $43,997, a difference of 16.5%.
Per Capita Income Correlation Summary
| Measurement | Guatemalan | Immigrants from Uruguay |
| Minimum | $12,606 | $21,194 |
| Maximum | $66,145 | $84,313 |
| Range | $53,539 | $63,119 |
| Mean | $29,994 | $42,012 |
| Median | $30,165 | $42,230 |
| Interquartile 25% (IQ1) | $24,578 | $32,137 |
| Interquartile 75% (IQ3) | $34,822 | $45,280 |
| Interquartile Range (IQR) | $10,244 | $13,143 |
| Standard Deviation (Sample) | $8,508 | $14,447 |
| Standard Deviation (Population) | $8,452 | $14,040 |
Similar Demographics by Per Capita Income
Demographics Similar to Guatemalans by Per Capita Income
In terms of per capita income, the demographic groups most similar to Guatemalans are African ($37,785, a difference of 0.050%), Central American Indian ($37,699, a difference of 0.18%), Dominican ($37,697, a difference of 0.19%), Blackfeet ($37,695, a difference of 0.19%), and Pennsylvania German ($37,842, a difference of 0.20%).
| Demographics | Rating | Rank | Per Capita Income |
| Immigrants | Nicaragua | 0.2 /100 | #278 | Tragic $38,065 |
| Colville | 0.2 /100 | #279 | Tragic $38,047 |
| Potawatomi | 0.2 /100 | #280 | Tragic $38,046 |
| Immigrants | Dominica | 0.2 /100 | #281 | Tragic $37,952 |
| Immigrants | Laos | 0.1 /100 | #282 | Tragic $37,857 |
| Pennsylvania Germans | 0.1 /100 | #283 | Tragic $37,842 |
| Africans | 0.1 /100 | #284 | Tragic $37,785 |
| Guatemalans | 0.1 /100 | #285 | Tragic $37,766 |
| Central American Indians | 0.1 /100 | #286 | Tragic $37,699 |
| Dominicans | 0.1 /100 | #287 | Tragic $37,697 |
| Blackfeet | 0.1 /100 | #288 | Tragic $37,695 |
| U.S. Virgin Islanders | 0.1 /100 | #289 | Tragic $37,589 |
| Immigrants | Guatemala | 0.1 /100 | #290 | Tragic $37,550 |
| Cajuns | 0.1 /100 | #291 | Tragic $37,527 |
| Immigrants | Micronesia | 0.1 /100 | #292 | Tragic $37,464 |
Demographics Similar to Immigrants from Uruguay by Per Capita Income
In terms of per capita income, the demographic groups most similar to Immigrants from Uruguay are Immigrants from Philippines ($44,000, a difference of 0.010%), English ($43,982, a difference of 0.030%), Sri Lankan ($44,014, a difference of 0.040%), Belgian ($43,951, a difference of 0.10%), and Immigrants from South America ($44,068, a difference of 0.16%).
| Demographics | Rating | Rank | Per Capita Income |
| South Americans | 62.4 /100 | #159 | Good $44,114 |
| Danes | 61.9 /100 | #160 | Good $44,095 |
| Costa Ricans | 61.8 /100 | #161 | Good $44,090 |
| Swiss | 61.4 /100 | #162 | Good $44,076 |
| Immigrants | South America | 61.2 /100 | #163 | Good $44,068 |
| Sri Lankans | 59.8 /100 | #164 | Average $44,014 |
| Immigrants | Philippines | 59.4 /100 | #165 | Average $44,000 |
| Immigrants | Uruguay | 59.3 /100 | #166 | Average $43,997 |
| English | 58.9 /100 | #167 | Average $43,982 |
| Belgians | 58.1 /100 | #168 | Average $43,951 |
| Immigrants | Peru | 55.3 /100 | #169 | Average $43,852 |
| Scandinavians | 55.2 /100 | #170 | Average $43,848 |
| Immigrants | Eastern Africa | 54.9 /100 | #171 | Average $43,838 |
| Czechoslovakians | 54.1 /100 | #172 | Average $43,806 |
| French | 50.7 /100 | #173 | Average $43,685 |