Guamanian/Chamorro vs Immigrants from Peru Median Family Income
COMPARE
Guamanian/Chamorro
Immigrants from Peru
Median Family Income
Median Family Income Comparison
Guamanians/Chamorros
Immigrants from Peru
$101,061
MEDIAN FAMILY INCOME
30.5/ 100
METRIC RATING
188th/ 347
METRIC RANK
$103,534
MEDIAN FAMILY INCOME
60.8/ 100
METRIC RATING
168th/ 347
METRIC RANK
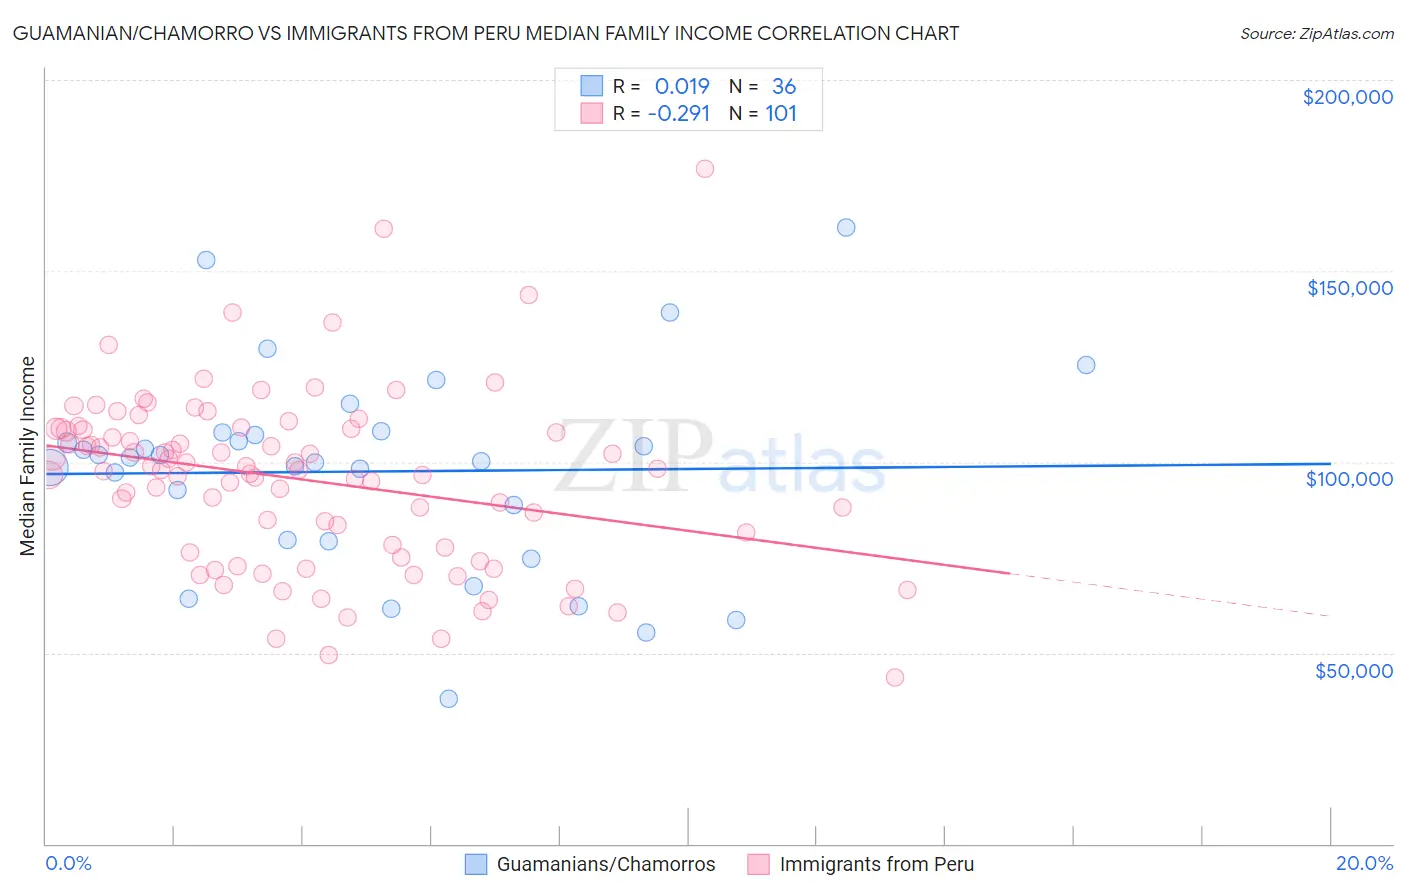
Guamanian/Chamorro vs Immigrants from Peru Median Family Income Correlation Chart
The statistical analysis conducted on geographies consisting of 221,859,912 people shows no correlation between the proportion of Guamanians/Chamorros and median family income in the United States with a correlation coefficient (R) of 0.019 and weighted average of $101,061. Similarly, the statistical analysis conducted on geographies consisting of 328,696,849 people shows a weak negative correlation between the proportion of Immigrants from Peru and median family income in the United States with a correlation coefficient (R) of -0.291 and weighted average of $103,534, a difference of 2.5%.
Median Family Income Correlation Summary
| Measurement | Guamanian/Chamorro | Immigrants from Peru |
| Minimum | $37,991 | $43,482 |
| Maximum | $161,250 | $176,625 |
| Range | $123,259 | $133,143 |
| Mean | $97,460 | $95,423 |
| Median | $100,672 | $98,015 |
| Interquartile 25% (IQ1) | $79,398 | $76,903 |
| Interquartile 75% (IQ3) | $107,355 | $108,609 |
| Interquartile Range (IQR) | $27,957 | $31,706 |
| Standard Deviation (Sample) | $26,595 | $22,960 |
| Standard Deviation (Population) | $26,223 | $22,846 |
Demographics Similar to Guamanians/Chamorros and Immigrants from Peru by Median Family Income
In terms of median family income, the demographic groups most similar to Guamanians/Chamorros are Tlingit-Haida ($101,092, a difference of 0.030%), Celtic ($101,139, a difference of 0.080%), Dutch ($101,192, a difference of 0.13%), Immigrants from Costa Rica ($101,354, a difference of 0.29%), and Kenyan ($101,417, a difference of 0.35%). Similarly, the demographic groups most similar to Immigrants from Peru are Czechoslovakian ($103,273, a difference of 0.25%), Immigrants from Uzbekistan ($103,197, a difference of 0.33%), Alsatian ($103,010, a difference of 0.51%), Immigrants from Eritrea ($102,823, a difference of 0.69%), and Belgian ($102,788, a difference of 0.73%).
| Demographics | Rating | Rank | Median Family Income |
| Immigrants | Peru | 60.8 /100 | #168 | Good $103,534 |
| Czechoslovakians | 57.6 /100 | #169 | Average $103,273 |
| Immigrants | Uzbekistan | 56.6 /100 | #170 | Average $103,197 |
| Alsatians | 54.3 /100 | #171 | Average $103,010 |
| Immigrants | Eritrea | 51.9 /100 | #172 | Average $102,823 |
| Belgians | 51.4 /100 | #173 | Average $102,788 |
| Finns | 50.0 /100 | #174 | Average $102,676 |
| Immigrants | Eastern Africa | 47.1 /100 | #175 | Average $102,451 |
| French | 46.1 /100 | #176 | Average $102,368 |
| Germans | 44.6 /100 | #177 | Average $102,254 |
| Welsh | 43.3 /100 | #178 | Average $102,151 |
| South Americans | 39.7 /100 | #179 | Fair $101,856 |
| French Canadians | 37.0 /100 | #180 | Fair $101,634 |
| Spaniards | 36.8 /100 | #181 | Fair $101,617 |
| Tsimshian | 35.9 /100 | #182 | Fair $101,543 |
| Kenyans | 34.5 /100 | #183 | Fair $101,417 |
| Immigrants | Costa Rica | 33.7 /100 | #184 | Fair $101,354 |
| Dutch | 31.9 /100 | #185 | Fair $101,192 |
| Celtics | 31.3 /100 | #186 | Fair $101,139 |
| Tlingit-Haida | 30.8 /100 | #187 | Fair $101,092 |
| Guamanians/Chamorros | 30.5 /100 | #188 | Fair $101,061 |