Guamanian/Chamorro vs Bangladeshi Median Family Income
COMPARE
Guamanian/Chamorro
Bangladeshi
Median Family Income
Median Family Income Comparison
Guamanians/Chamorros
Bangladeshis
$101,061
MEDIAN FAMILY INCOME
30.5/ 100
METRIC RATING
188th/ 347
METRIC RANK
$88,358
MEDIAN FAMILY INCOME
0.1/ 100
METRIC RATING
283rd/ 347
METRIC RANK
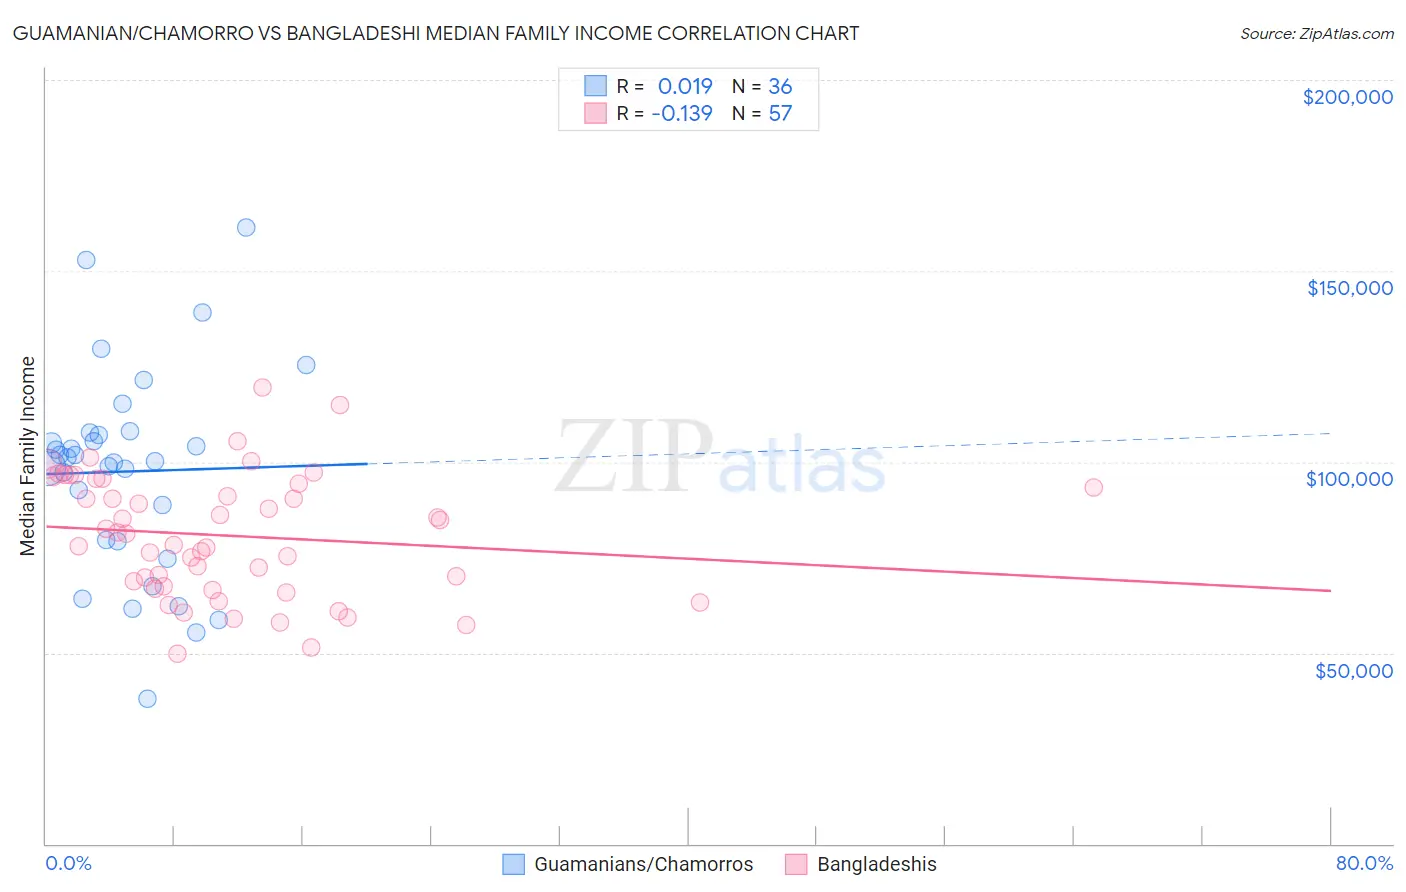
Guamanian/Chamorro vs Bangladeshi Median Family Income Correlation Chart
The statistical analysis conducted on geographies consisting of 221,859,912 people shows no correlation between the proportion of Guamanians/Chamorros and median family income in the United States with a correlation coefficient (R) of 0.019 and weighted average of $101,061. Similarly, the statistical analysis conducted on geographies consisting of 141,321,089 people shows a poor negative correlation between the proportion of Bangladeshis and median family income in the United States with a correlation coefficient (R) of -0.139 and weighted average of $88,358, a difference of 14.4%.
Median Family Income Correlation Summary
| Measurement | Guamanian/Chamorro | Bangladeshi |
| Minimum | $37,991 | $49,670 |
| Maximum | $161,250 | $119,471 |
| Range | $123,259 | $69,801 |
| Mean | $97,460 | $80,654 |
| Median | $100,672 | $81,226 |
| Interquartile 25% (IQ1) | $79,398 | $67,095 |
| Interquartile 75% (IQ3) | $107,355 | $94,926 |
| Interquartile Range (IQR) | $27,957 | $27,831 |
| Standard Deviation (Sample) | $26,595 | $16,058 |
| Standard Deviation (Population) | $26,223 | $15,916 |
Similar Demographics by Median Family Income
Demographics Similar to Guamanians/Chamorros by Median Family Income
In terms of median family income, the demographic groups most similar to Guamanians/Chamorros are Tlingit-Haida ($101,092, a difference of 0.030%), Celtic ($101,139, a difference of 0.080%), Immigrants from Portugal ($100,984, a difference of 0.080%), Immigrants ($100,962, a difference of 0.10%), and Dutch ($101,192, a difference of 0.13%).
| Demographics | Rating | Rank | Median Family Income |
| Spaniards | 36.8 /100 | #181 | Fair $101,617 |
| Tsimshian | 35.9 /100 | #182 | Fair $101,543 |
| Kenyans | 34.5 /100 | #183 | Fair $101,417 |
| Immigrants | Costa Rica | 33.7 /100 | #184 | Fair $101,354 |
| Dutch | 31.9 /100 | #185 | Fair $101,192 |
| Celtics | 31.3 /100 | #186 | Fair $101,139 |
| Tlingit-Haida | 30.8 /100 | #187 | Fair $101,092 |
| Guamanians/Chamorros | 30.5 /100 | #188 | Fair $101,061 |
| Immigrants | Portugal | 29.6 /100 | #189 | Fair $100,984 |
| Immigrants | Immigrants | 29.4 /100 | #190 | Fair $100,962 |
| Colombians | 27.2 /100 | #191 | Fair $100,750 |
| Immigrants | Kenya | 26.5 /100 | #192 | Fair $100,679 |
| Iraqis | 26.3 /100 | #193 | Fair $100,658 |
| Uruguayans | 26.3 /100 | #194 | Fair $100,656 |
| Immigrants | South America | 23.9 /100 | #195 | Fair $100,414 |
Demographics Similar to Bangladeshis by Median Family Income
In terms of median family income, the demographic groups most similar to Bangladeshis are Indonesian ($88,301, a difference of 0.060%), Guatemalan ($88,295, a difference of 0.070%), Immigrants from Nicaragua ($88,267, a difference of 0.10%), Potawatomi ($88,265, a difference of 0.11%), and Cherokee ($88,209, a difference of 0.17%).
| Demographics | Rating | Rank | Median Family Income |
| Immigrants | Zaire | 0.1 /100 | #276 | Tragic $89,285 |
| Immigrants | Jamaica | 0.1 /100 | #277 | Tragic $89,268 |
| Immigrants | Grenada | 0.1 /100 | #278 | Tragic $89,249 |
| Immigrants | Belize | 0.1 /100 | #279 | Tragic $89,197 |
| British West Indians | 0.1 /100 | #280 | Tragic $88,987 |
| Blackfeet | 0.1 /100 | #281 | Tragic $88,717 |
| Comanche | 0.1 /100 | #282 | Tragic $88,556 |
| Bangladeshis | 0.1 /100 | #283 | Tragic $88,358 |
| Indonesians | 0.1 /100 | #284 | Tragic $88,301 |
| Guatemalans | 0.1 /100 | #285 | Tragic $88,295 |
| Immigrants | Nicaragua | 0.1 /100 | #286 | Tragic $88,267 |
| Potawatomi | 0.1 /100 | #287 | Tragic $88,265 |
| Cherokee | 0.1 /100 | #288 | Tragic $88,209 |
| Central American Indians | 0.1 /100 | #289 | Tragic $88,034 |
| Shoshone | 0.1 /100 | #290 | Tragic $87,872 |