Cherokee vs Immigrants from Peru Median Family Income
COMPARE
Cherokee
Immigrants from Peru
Median Family Income
Median Family Income Comparison
Cherokee
Immigrants from Peru
$88,209
MEDIAN FAMILY INCOME
0.1/ 100
METRIC RATING
288th/ 347
METRIC RANK
$103,534
MEDIAN FAMILY INCOME
60.8/ 100
METRIC RATING
168th/ 347
METRIC RANK
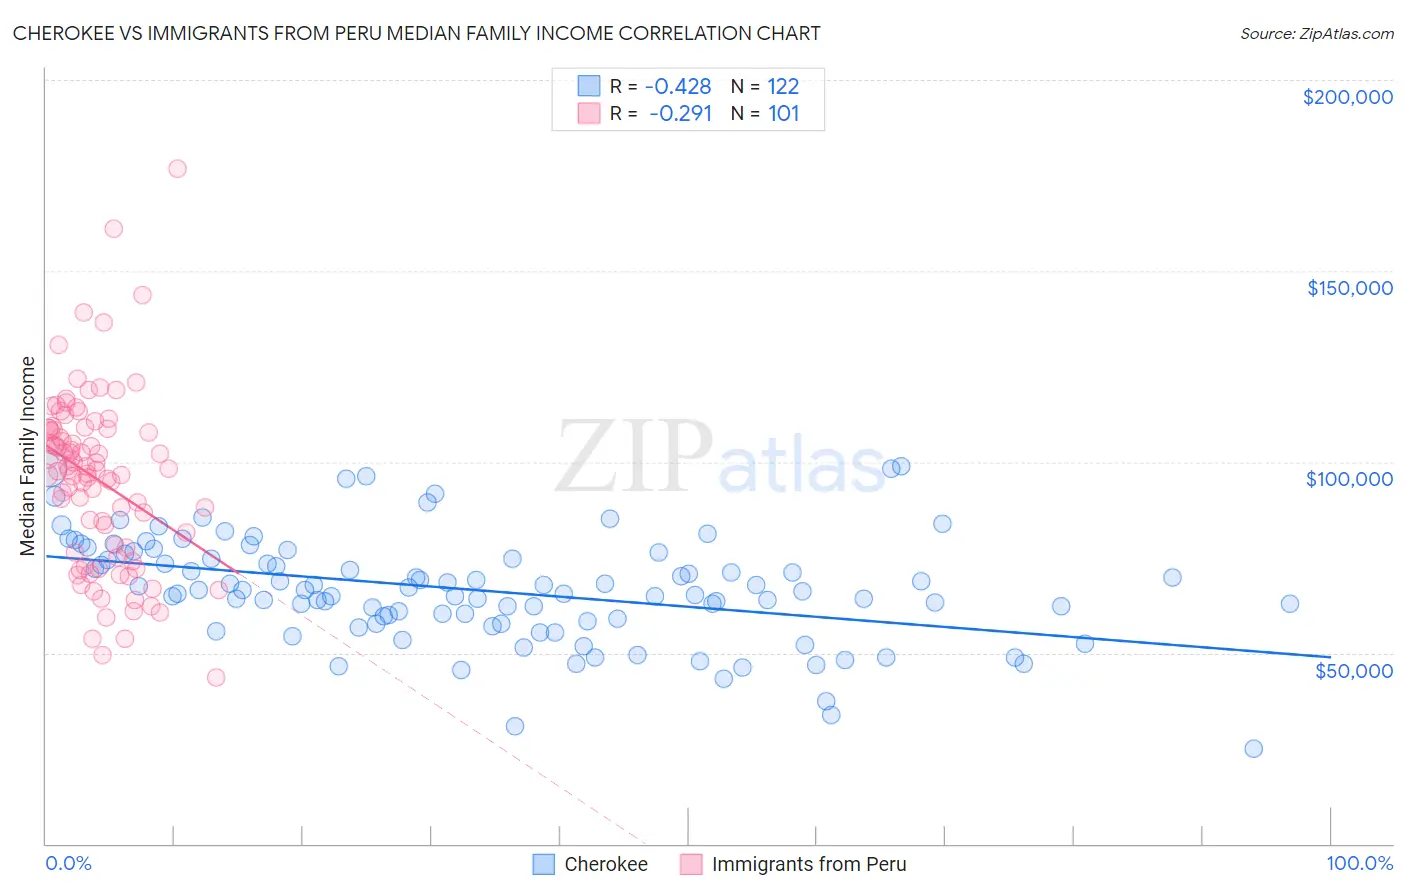
Cherokee vs Immigrants from Peru Median Family Income Correlation Chart
The statistical analysis conducted on geographies consisting of 493,078,219 people shows a moderate negative correlation between the proportion of Cherokee and median family income in the United States with a correlation coefficient (R) of -0.428 and weighted average of $88,209. Similarly, the statistical analysis conducted on geographies consisting of 328,696,849 people shows a weak negative correlation between the proportion of Immigrants from Peru and median family income in the United States with a correlation coefficient (R) of -0.291 and weighted average of $103,534, a difference of 17.4%.
Median Family Income Correlation Summary
| Measurement | Cherokee | Immigrants from Peru |
| Minimum | $25,000 | $43,482 |
| Maximum | $98,929 | $176,625 |
| Range | $73,929 | $133,143 |
| Mean | $66,366 | $95,423 |
| Median | $66,333 | $98,015 |
| Interquartile 25% (IQ1) | $58,393 | $76,903 |
| Interquartile 75% (IQ3) | $74,712 | $108,609 |
| Interquartile Range (IQR) | $16,319 | $31,706 |
| Standard Deviation (Sample) | $13,972 | $22,960 |
| Standard Deviation (Population) | $13,915 | $22,846 |
Similar Demographics by Median Family Income
Demographics Similar to Cherokee by Median Family Income
In terms of median family income, the demographic groups most similar to Cherokee are Potawatomi ($88,265, a difference of 0.060%), Immigrants from Nicaragua ($88,267, a difference of 0.070%), Indonesian ($88,301, a difference of 0.10%), Guatemalan ($88,295, a difference of 0.10%), and Bangladeshi ($88,358, a difference of 0.17%).
| Demographics | Rating | Rank | Median Family Income |
| Blackfeet | 0.1 /100 | #281 | Tragic $88,717 |
| Comanche | 0.1 /100 | #282 | Tragic $88,556 |
| Bangladeshis | 0.1 /100 | #283 | Tragic $88,358 |
| Indonesians | 0.1 /100 | #284 | Tragic $88,301 |
| Guatemalans | 0.1 /100 | #285 | Tragic $88,295 |
| Immigrants | Nicaragua | 0.1 /100 | #286 | Tragic $88,267 |
| Potawatomi | 0.1 /100 | #287 | Tragic $88,265 |
| Cherokee | 0.1 /100 | #288 | Tragic $88,209 |
| Central American Indians | 0.1 /100 | #289 | Tragic $88,034 |
| Shoshone | 0.1 /100 | #290 | Tragic $87,872 |
| Immigrants | Cabo Verde | 0.1 /100 | #291 | Tragic $87,830 |
| Africans | 0.1 /100 | #292 | Tragic $87,820 |
| Ute | 0.0 /100 | #293 | Tragic $87,596 |
| Fijians | 0.0 /100 | #294 | Tragic $87,387 |
| Yaqui | 0.0 /100 | #295 | Tragic $87,289 |
Demographics Similar to Immigrants from Peru by Median Family Income
In terms of median family income, the demographic groups most similar to Immigrants from Peru are South American Indian ($103,624, a difference of 0.090%), English ($103,684, a difference of 0.15%), Slovak ($103,729, a difference of 0.19%), Czechoslovakian ($103,273, a difference of 0.25%), and Sierra Leonean ($103,859, a difference of 0.31%).
| Demographics | Rating | Rank | Median Family Income |
| Icelanders | 69.4 /100 | #161 | Good $104,282 |
| Immigrants | Sierra Leone | 66.2 /100 | #162 | Good $103,990 |
| Costa Ricans | 66.2 /100 | #163 | Good $103,989 |
| Sierra Leoneans | 64.7 /100 | #164 | Good $103,859 |
| Slovaks | 63.1 /100 | #165 | Good $103,729 |
| English | 62.6 /100 | #166 | Good $103,684 |
| South American Indians | 61.9 /100 | #167 | Good $103,624 |
| Immigrants | Peru | 60.8 /100 | #168 | Good $103,534 |
| Czechoslovakians | 57.6 /100 | #169 | Average $103,273 |
| Immigrants | Uzbekistan | 56.6 /100 | #170 | Average $103,197 |
| Alsatians | 54.3 /100 | #171 | Average $103,010 |
| Immigrants | Eritrea | 51.9 /100 | #172 | Average $102,823 |
| Belgians | 51.4 /100 | #173 | Average $102,788 |
| Finns | 50.0 /100 | #174 | Average $102,676 |
| Immigrants | Eastern Africa | 47.1 /100 | #175 | Average $102,451 |