Guamanian/Chamorro vs Immigrants from Middle Africa Median Family Income
COMPARE
Guamanian/Chamorro
Immigrants from Middle Africa
Median Family Income
Median Family Income Comparison
Guamanians/Chamorros
Immigrants from Middle Africa
$101,061
MEDIAN FAMILY INCOME
30.5/ 100
METRIC RATING
188th/ 347
METRIC RANK
$93,593
MEDIAN FAMILY INCOME
1.0/ 100
METRIC RATING
245th/ 347
METRIC RANK
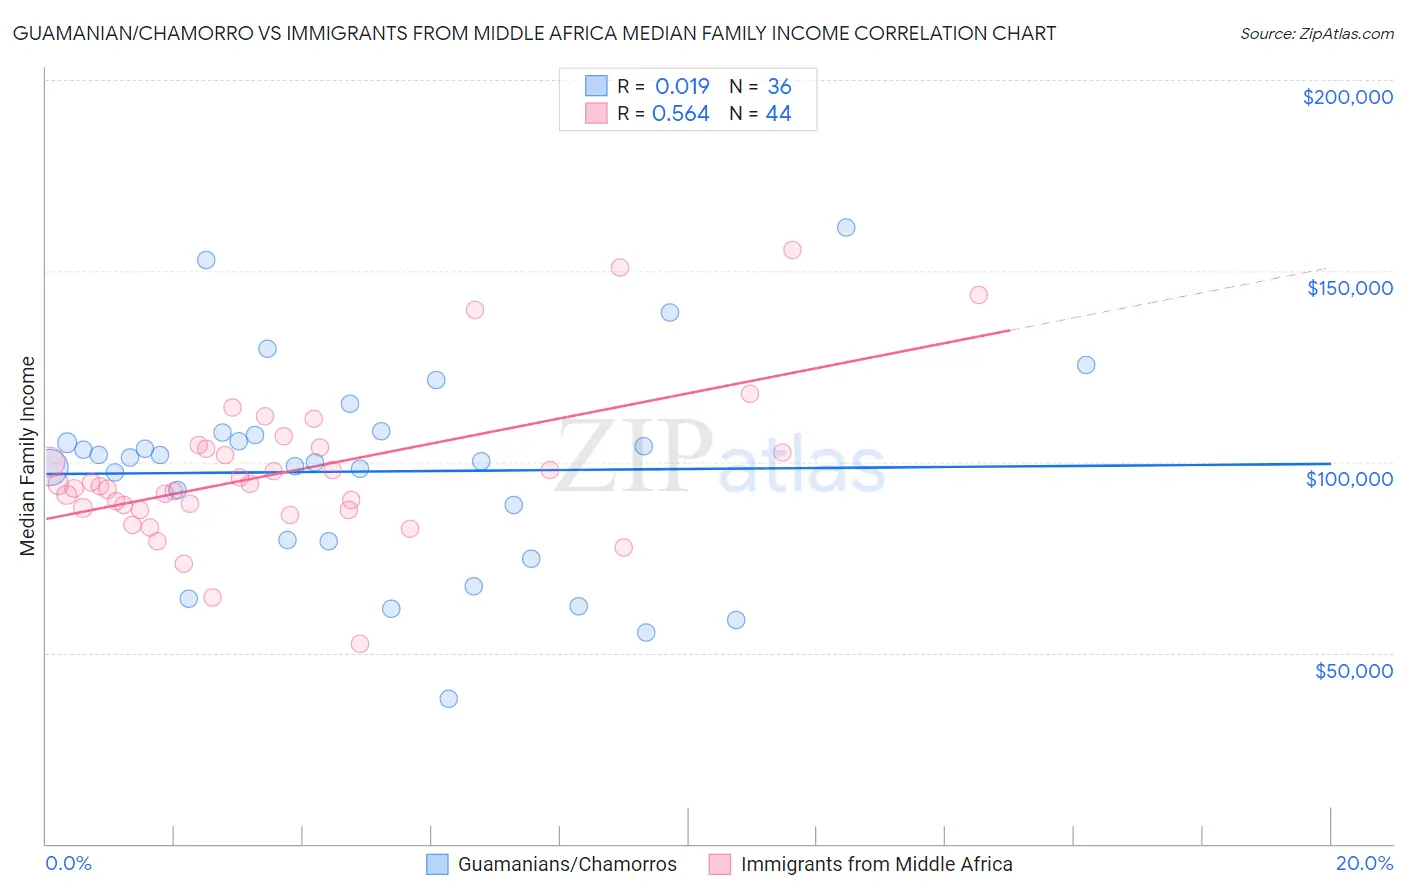
Guamanian/Chamorro vs Immigrants from Middle Africa Median Family Income Correlation Chart
The statistical analysis conducted on geographies consisting of 221,859,912 people shows no correlation between the proportion of Guamanians/Chamorros and median family income in the United States with a correlation coefficient (R) of 0.019 and weighted average of $101,061. Similarly, the statistical analysis conducted on geographies consisting of 202,625,103 people shows a substantial positive correlation between the proportion of Immigrants from Middle Africa and median family income in the United States with a correlation coefficient (R) of 0.564 and weighted average of $93,593, a difference of 8.0%.
Median Family Income Correlation Summary
| Measurement | Guamanian/Chamorro | Immigrants from Middle Africa |
| Minimum | $37,991 | $52,432 |
| Maximum | $161,250 | $155,375 |
| Range | $123,259 | $102,943 |
| Mean | $97,460 | $97,654 |
| Median | $100,672 | $93,999 |
| Interquartile 25% (IQ1) | $79,398 | $87,639 |
| Interquartile 75% (IQ3) | $107,355 | $103,622 |
| Interquartile Range (IQR) | $27,957 | $15,984 |
| Standard Deviation (Sample) | $26,595 | $20,164 |
| Standard Deviation (Population) | $26,223 | $19,934 |
Similar Demographics by Median Family Income
Demographics Similar to Guamanians/Chamorros by Median Family Income
In terms of median family income, the demographic groups most similar to Guamanians/Chamorros are Tlingit-Haida ($101,092, a difference of 0.030%), Celtic ($101,139, a difference of 0.080%), Immigrants from Portugal ($100,984, a difference of 0.080%), Immigrants ($100,962, a difference of 0.10%), and Dutch ($101,192, a difference of 0.13%).
| Demographics | Rating | Rank | Median Family Income |
| Spaniards | 36.8 /100 | #181 | Fair $101,617 |
| Tsimshian | 35.9 /100 | #182 | Fair $101,543 |
| Kenyans | 34.5 /100 | #183 | Fair $101,417 |
| Immigrants | Costa Rica | 33.7 /100 | #184 | Fair $101,354 |
| Dutch | 31.9 /100 | #185 | Fair $101,192 |
| Celtics | 31.3 /100 | #186 | Fair $101,139 |
| Tlingit-Haida | 30.8 /100 | #187 | Fair $101,092 |
| Guamanians/Chamorros | 30.5 /100 | #188 | Fair $101,061 |
| Immigrants | Portugal | 29.6 /100 | #189 | Fair $100,984 |
| Immigrants | Immigrants | 29.4 /100 | #190 | Fair $100,962 |
| Colombians | 27.2 /100 | #191 | Fair $100,750 |
| Immigrants | Kenya | 26.5 /100 | #192 | Fair $100,679 |
| Iraqis | 26.3 /100 | #193 | Fair $100,658 |
| Uruguayans | 26.3 /100 | #194 | Fair $100,656 |
| Immigrants | South America | 23.9 /100 | #195 | Fair $100,414 |
Demographics Similar to Immigrants from Middle Africa by Median Family Income
In terms of median family income, the demographic groups most similar to Immigrants from Middle Africa are Subsaharan African ($93,748, a difference of 0.17%), Guyanese ($93,373, a difference of 0.23%), German Russian ($93,858, a difference of 0.28%), Barbadian ($93,919, a difference of 0.35%), and Immigrants from Trinidad and Tobago ($93,988, a difference of 0.42%).
| Demographics | Rating | Rank | Median Family Income |
| Nepalese | 1.3 /100 | #238 | Tragic $94,153 |
| Salvadorans | 1.2 /100 | #239 | Tragic $94,109 |
| Somalis | 1.2 /100 | #240 | Tragic $94,085 |
| Immigrants | Trinidad and Tobago | 1.2 /100 | #241 | Tragic $93,988 |
| Barbadians | 1.1 /100 | #242 | Tragic $93,919 |
| German Russians | 1.1 /100 | #243 | Tragic $93,858 |
| Sub-Saharan Africans | 1.0 /100 | #244 | Tragic $93,748 |
| Immigrants | Middle Africa | 1.0 /100 | #245 | Tragic $93,593 |
| Guyanese | 0.9 /100 | #246 | Tragic $93,373 |
| Immigrants | Senegal | 0.7 /100 | #247 | Tragic $92,912 |
| French American Indians | 0.7 /100 | #248 | Tragic $92,872 |
| Immigrants | Ecuador | 0.7 /100 | #249 | Tragic $92,837 |
| West Indians | 0.6 /100 | #250 | Tragic $92,765 |
| Immigrants | Somalia | 0.6 /100 | #251 | Tragic $92,609 |
| Immigrants | El Salvador | 0.6 /100 | #252 | Tragic $92,545 |