Guamanian/Chamorro vs Immigrants from Peru Unemployment Among Seniors over 75 years
COMPARE
Guamanian/Chamorro
Immigrants from Peru
Unemployment Among Seniors over 75 years
Unemployment Among Seniors over 75 years Comparison
Guamanians/Chamorros
Immigrants from Peru
9.0%
UNEMPLOYMENT AMONG SENIORS OVER 75 YEARS
7.7/ 100
METRIC RATING
221st/ 347
METRIC RANK
8.9%
UNEMPLOYMENT AMONG SENIORS OVER 75 YEARS
24.3/ 100
METRIC RATING
201st/ 347
METRIC RANK
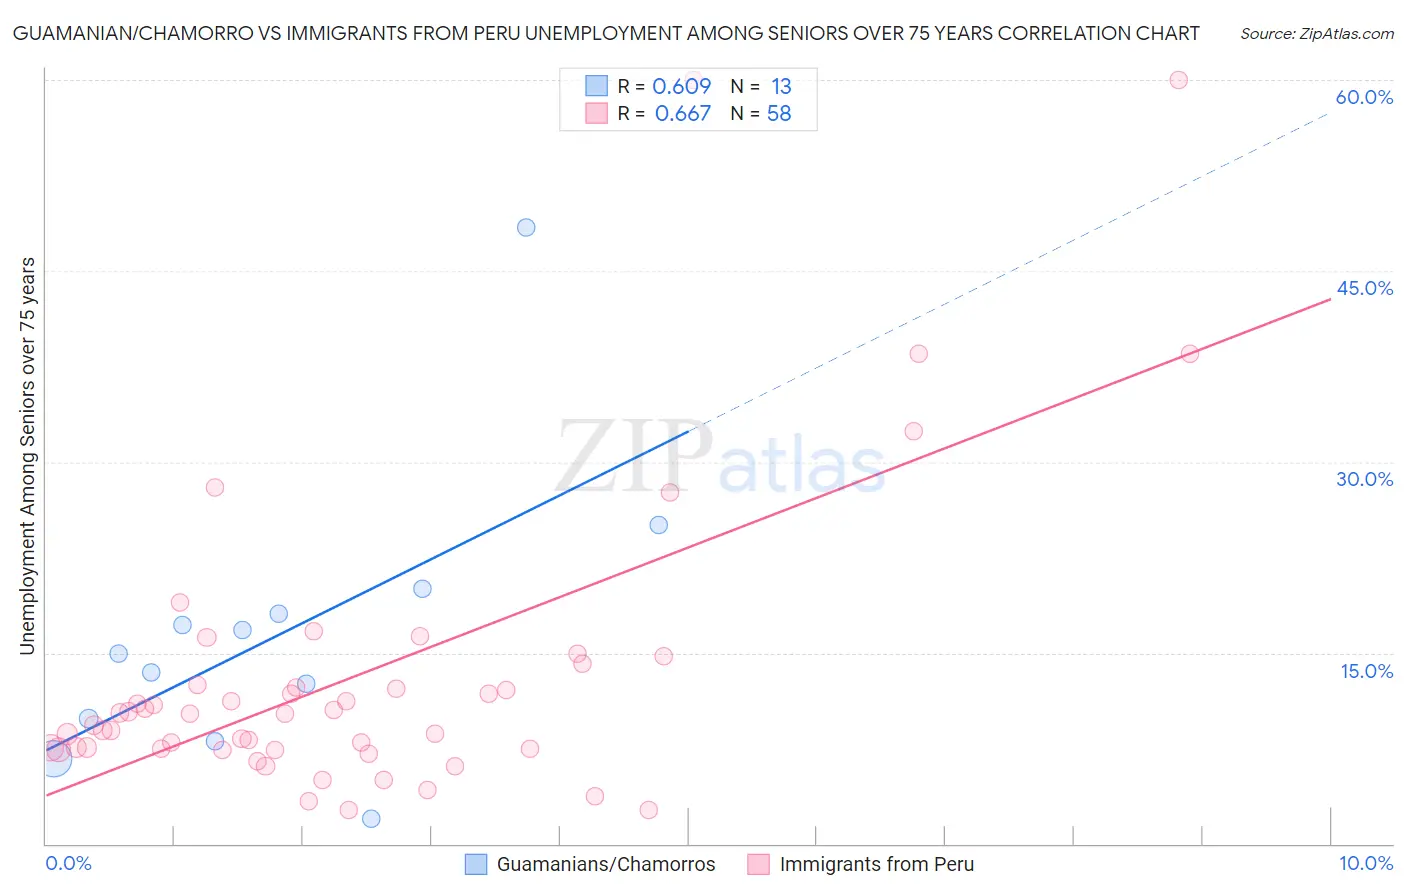
Guamanian/Chamorro vs Immigrants from Peru Unemployment Among Seniors over 75 years Correlation Chart
The statistical analysis conducted on geographies consisting of 136,667,243 people shows a significant positive correlation between the proportion of Guamanians/Chamorros and unemployment rate among seniors over the age of 75 in the United States with a correlation coefficient (R) of 0.609 and weighted average of 9.0%. Similarly, the statistical analysis conducted on geographies consisting of 181,477,141 people shows a significant positive correlation between the proportion of Immigrants from Peru and unemployment rate among seniors over the age of 75 in the United States with a correlation coefficient (R) of 0.667 and weighted average of 8.9%, a difference of 1.8%.
Unemployment Among Seniors over 75 years Correlation Summary
| Measurement | Guamanian/Chamorro | Immigrants from Peru |
| Minimum | 2.0% | 2.7% |
| Maximum | 48.4% | 60.0% |
| Range | 46.4% | 57.3% |
| Mean | 16.4% | 13.2% |
| Median | 14.9% | 10.2% |
| Interquartile 25% (IQ1) | 8.9% | 7.4% |
| Interquartile 75% (IQ3) | 19.0% | 12.5% |
| Interquartile Range (IQR) | 10.1% | 5.0% |
| Standard Deviation (Sample) | 11.4% | 11.7% |
| Standard Deviation (Population) | 10.9% | 11.6% |
Demographics Similar to Guamanians/Chamorros and Immigrants from Peru by Unemployment Among Seniors over 75 years
In terms of unemployment among seniors over 75 years, the demographic groups most similar to Guamanians/Chamorros are Immigrants from Zimbabwe (9.0%, a difference of 0.020%), Afghan (9.0%, a difference of 0.10%), Immigrants from Africa (9.0%, a difference of 0.34%), Lebanese (9.0%, a difference of 0.52%), and Immigrants from Oceania (9.0%, a difference of 0.62%). Similarly, the demographic groups most similar to Immigrants from Peru are Russian (8.9%, a difference of 0.010%), Immigrants from Northern Europe (8.9%, a difference of 0.030%), Spaniard (8.9%, a difference of 0.17%), Korean (8.9%, a difference of 0.18%), and Immigrants from Western Europe (8.9%, a difference of 0.48%).
| Demographics | Rating | Rank | Unemployment Among Seniors over 75 years |
| Immigrants | Peru | 24.3 /100 | #201 | Fair 8.9% |
| Russians | 24.1 /100 | #202 | Fair 8.9% |
| Immigrants | Northern Europe | 23.9 /100 | #203 | Fair 8.9% |
| Spaniards | 22.0 /100 | #204 | Fair 8.9% |
| Koreans | 21.9 /100 | #205 | Fair 8.9% |
| Immigrants | Western Europe | 18.2 /100 | #206 | Poor 8.9% |
| Malaysians | 16.3 /100 | #207 | Poor 8.9% |
| Immigrants | Philippines | 15.8 /100 | #208 | Poor 8.9% |
| Salvadorans | 15.4 /100 | #209 | Poor 8.9% |
| Bermudans | 15.0 /100 | #210 | Poor 8.9% |
| Delaware | 14.6 /100 | #211 | Poor 9.0% |
| Romanians | 13.8 /100 | #212 | Poor 9.0% |
| Immigrants | Latin America | 13.4 /100 | #213 | Poor 9.0% |
| Immigrants | Brazil | 13.3 /100 | #214 | Poor 9.0% |
| Immigrants | Western Asia | 12.5 /100 | #215 | Poor 9.0% |
| Immigrants | Oceania | 11.8 /100 | #216 | Poor 9.0% |
| Lebanese | 11.1 /100 | #217 | Poor 9.0% |
| Immigrants | Africa | 9.7 /100 | #218 | Tragic 9.0% |
| Afghans | 8.3 /100 | #219 | Tragic 9.0% |
| Immigrants | Zimbabwe | 7.8 /100 | #220 | Tragic 9.0% |
| Guamanians/Chamorros | 7.7 /100 | #221 | Tragic 9.0% |