Spanish vs Immigrants from Peru Median Family Income

COMPARE

Spanish
Race
Ancestry
AfghanAfricanAlaska NativeAlaskan AthabascanAlbanianAleutAlsatianAmericanApacheArabArapahoArgentineanArmenianAssyrian/Chaldean/SyriacAustralianAustrianBahamianBangladeshiBarbadianBasqueBelgianBelizeanBermudanBhutaneseBlackfeetBolivianBrazilianBritishBritish West IndianBulgarianBurmeseCajunCambodianCanadianCape VerdeanCarpatho RusynCelticCentral AmericanCentral American IndianCherokeeCheyenneChickasawChileanChineseChippewaChoctawColombianColvilleComancheCosta RicanCreeCreekCroatianCrowCubanCypriotCzechCzechoslovakianDanishDelawareDominicanDutchDutch West IndianEastern EuropeanEcuadorianEgyptianEnglishEstonianEthiopianEuropeanFijianFilipinoFinnishFrenchFrench American IndianFrench CanadianGermanGerman RussianGhanaianGreekGuamanian/ChamorroGuatemalanGuyaneseHaitianHmongHonduranHopiHoumaHungarianIcelanderIndian (Asian)IndonesianInupiatIranianIraqiIrishIroquoisIsraeliItalianJamaicanJapaneseJordanianKenyanKiowaKoreanLaotianLatvianLebaneseLiberianLithuanianLumbeeLuxembourgerMacedonianMalaysianMalteseMarshalleseMenomineeMexicanMexican American IndianMongolianMoroccanNative HawaiianNavajoNepaleseNew ZealanderNicaraguanNigerianNorthern EuropeanNorwegianOkinawanOsageOttawaPaiutePakistaniPalestinianPanamanianParaguayanPennsylvania GermanPeruvianPimaPolishPortuguesePotawatomiPuebloPuerto RicanPuget Sound SalishRomanianRussianSalvadoranSamoanScandinavianScotch-IrishScottishSeminoleSenegaleseSerbianShoshoneSierra LeoneanSiouxSlavicSlovakSloveneSomaliSouth AfricanSouth AmericanSouth American IndianSoviet UnionSpaniardSpanishSpanish AmericanSpanish American IndianSri LankanSubsaharan AfricanSudaneseSwedishSwissSyrianTaiwaneseThaiTlingit-HaidaTohono O'OdhamTonganTrinidadian and TobagonianTsimshianTurkishU.S. Virgin IslanderUgandanUkrainianUruguayanUteVenezuelanVietnameseWelshWest IndianYakamaYaquiYugoslavianYumanYup'ikZimbabwean
Immigration
NonimmigrantsImmigrantsAfghanistanAfricaAlbaniaArgentinaArmeniaAsiaAustraliaAustriaBahamasBangladeshBarbadosBelarusBelgiumBelizeBoliviaBosnia and HerzegovinaBrazilBulgariaBurma/MyanmarCabo VerdeCambodiaCameroonCanadaCaribbeanCentral AmericaChileChinaColombiaCongoCosta RicaCroatiaCubaCzechoslovakiaDenmarkDominicaDominican RepublicEastern AfricaEastern AsiaEastern EuropeEcuadorEgyptEl SalvadorEnglandEritreaEthiopiaEuropeFijiFranceGermanyGhanaGreeceGrenadaGuatemalaGuyanaHaitiHondurasHong KongHungaryIndiaIndonesiaIranIraqIrelandIsraelItalyJamaicaJapanJordanKazakhstanKenyaKoreaKuwaitLaosLatin AmericaLatviaLebanonLiberiaLithuaniaMalaysiaMexicoMicronesiaMiddle AfricaMoldovaMoroccoNepalNetherlandsNicaraguaNigeriaNorth AmericaNorth MacedoniaNorthern AfricaNorthern EuropeNorwayOceaniaPakistanPanamaPhilippinesPolandPortugalRomaniaRussiaSaudi ArabiaScotlandSenegalSerbiaSierra LeoneSingaporeSomaliaSouth AfricaSouth AmericaSouth Central AsiaSouth Eastern AsiaSouthern EuropeSpainSri LankaSt. Vincent and the GrenadinesSudanSwedenSwitzerlandSyriaTaiwanThailandTrinidad and TobagoTurkeyUgandaUkraineUruguayUzbekistanVenezuelaVietnamWest IndiesWestern AfricaWestern AsiaWestern EuropeYemenZaireZimbabweAzores
Immigrants from Peru
Race
Ancestry
AfghanAfricanAlaska NativeAlaskan AthabascanAlbanianAleutAlsatianAmericanApacheArabArapahoArgentineanArmenianAssyrian/Chaldean/SyriacAustralianAustrianBahamianBangladeshiBarbadianBasqueBelgianBelizeanBermudanBhutaneseBlackfeetBolivianBrazilianBritishBritish West IndianBulgarianBurmeseCajunCambodianCanadianCape VerdeanCarpatho RusynCelticCentral AmericanCentral American IndianCherokeeCheyenneChickasawChileanChineseChippewaChoctawColombianColvilleComancheCosta RicanCreeCreekCroatianCrowCubanCypriotCzechCzechoslovakianDanishDelawareDominicanDutchDutch West IndianEastern EuropeanEcuadorianEgyptianEnglishEstonianEthiopianEuropeanFijianFilipinoFinnishFrenchFrench American IndianFrench CanadianGermanGerman RussianGhanaianGreekGuamanian/ChamorroGuatemalanGuyaneseHaitianHmongHonduranHopiHoumaHungarianIcelanderIndian (Asian)IndonesianInupiatIranianIraqiIrishIroquoisIsraeliItalianJamaicanJapaneseJordanianKenyanKiowaKoreanLaotianLatvianLebaneseLiberianLithuanianLumbeeLuxembourgerMacedonianMalaysianMalteseMarshalleseMenomineeMexicanMexican American IndianMongolianMoroccanNative HawaiianNavajoNepaleseNew ZealanderNicaraguanNigerianNorthern EuropeanNorwegianOkinawanOsageOttawaPaiutePakistaniPalestinianPanamanianParaguayanPennsylvania GermanPeruvianPimaPolishPortuguesePotawatomiPuebloPuerto RicanPuget Sound SalishRomanianRussianSalvadoranSamoanScandinavianScotch-IrishScottishSeminoleSenegaleseSerbianShoshoneSierra LeoneanSiouxSlavicSlovakSloveneSomaliSouth AfricanSouth AmericanSouth American IndianSoviet UnionSpaniardSpanish AmericanSpanish American IndianSri LankanSubsaharan AfricanSudaneseSwedishSwissSyrianTaiwaneseThaiTlingit-HaidaTohono O'OdhamTonganTrinidadian and TobagonianTsimshianTurkishU.S. Virgin IslanderUgandanUkrainianUruguayanUteVenezuelanVietnameseWelshWest IndianYakamaYaquiYugoslavianYumanYup'ikZimbabwean
Immigration
NonimmigrantsImmigrantsAfghanistanAfricaAlbaniaArgentinaArmeniaAsiaAustraliaAustriaBahamasBangladeshBarbadosBelarusBelgiumBelizeBoliviaBosnia and HerzegovinaBrazilBulgariaBurma/MyanmarCabo VerdeCambodiaCameroonCanadaCaribbeanCentral AmericaChileChinaColombiaCongoCosta RicaCroatiaCubaCzechoslovakiaDenmarkDominicaDominican RepublicEastern AfricaEastern AsiaEastern EuropeEcuadorEgyptEl SalvadorEnglandEritreaEthiopiaEuropeFijiFranceGermanyGhanaGreeceGrenadaGuatemalaGuyanaHaitiHondurasHong KongHungaryIndiaIndonesiaIranIraqIrelandIsraelItalyJamaicaJapanJordanKazakhstanKenyaKoreaKuwaitLaosLatin AmericaLatviaLebanonLiberiaLithuaniaMalaysiaMexicoMicronesiaMiddle AfricaMoldovaMoroccoNepalNetherlandsNicaraguaNigeriaNorth AmericaNorth MacedoniaNorthern AfricaNorthern EuropeNorwayOceaniaPakistanPanamaPeruPhilippinesPolandPortugalRomaniaRussiaSaudi ArabiaScotlandSenegalSerbiaSierra LeoneSingaporeSomaliaSouth AfricaSouth AmericaSouth Central AsiaSouth Eastern AsiaSouthern EuropeSpainSri LankaSt. Vincent and the GrenadinesSudanSwedenSwitzerlandSyriaTaiwanThailandTrinidad and TobagoTurkeyUgandaUkraineUruguayUzbekistanVenezuelaVietnamWest IndiesWestern AfricaWestern AsiaWestern EuropeYemenZaireZimbabweAzores
Median Family Income
Income
Poverty
Unemployment
Labor Participation
Family Structure
Vehicle Availability
Education Level
Disability

Median Family Income Comparison

Spanish

Immigrants from Peru

Fair
Good
$99,977
MEDIAN FAMILY INCOME
20.1/ 100
METRIC RATING
200th/ 347
METRIC RANK
$103,534
MEDIAN FAMILY INCOME
60.8/ 100
METRIC RATING
168th/ 347
METRIC RANK

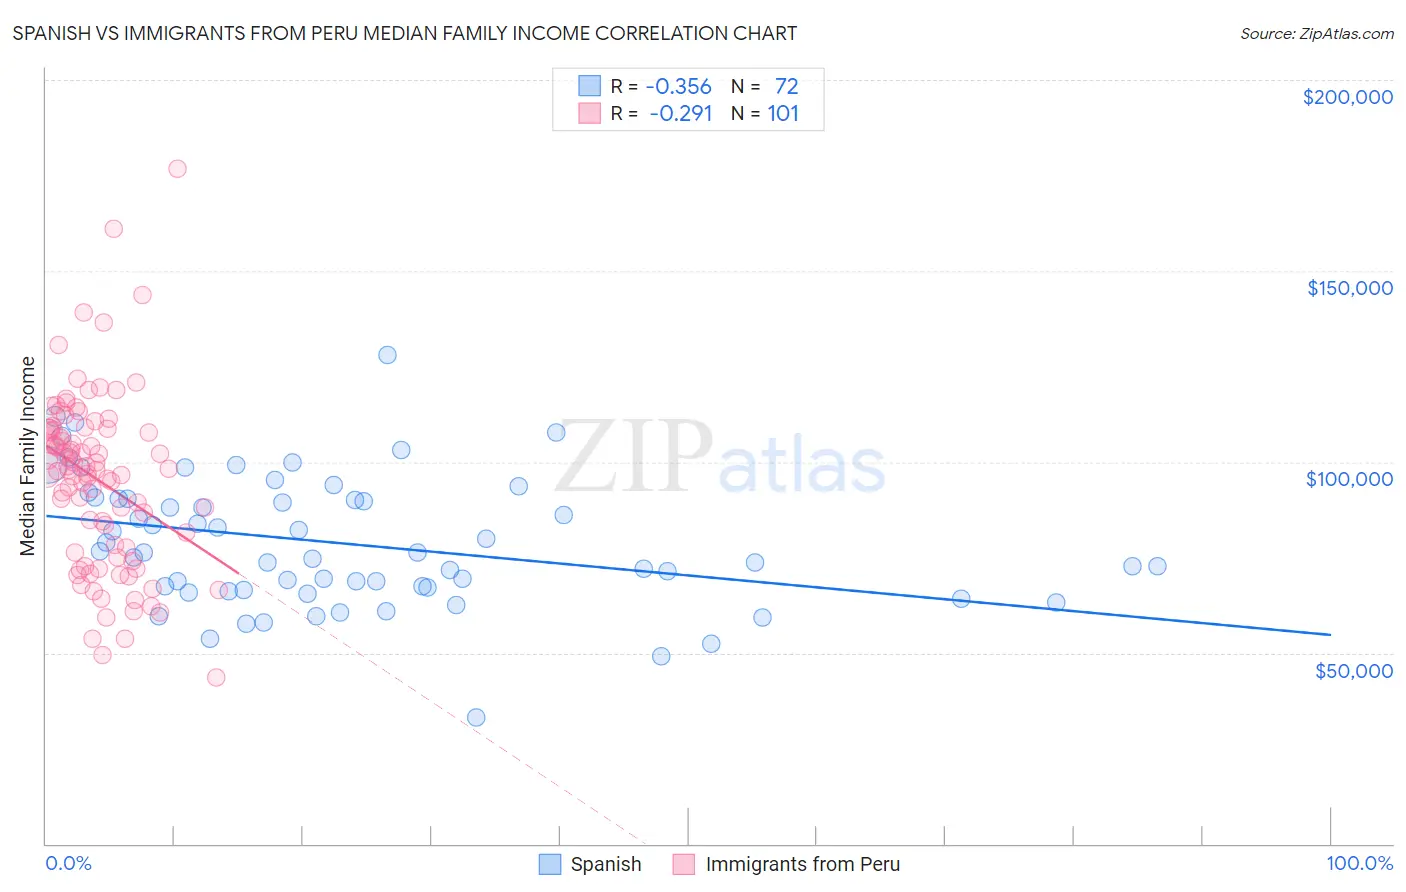
Spanish vs Immigrants from Peru Median Family Income Correlation Chart

The statistical analysis conducted on geographies consisting of 421,758,667 people shows a mild negative correlation between the proportion of Spanish and median family income in the United States with a correlation coefficient (R) of -0.356 and weighted average of $99,977. Similarly, the statistical analysis conducted on geographies consisting of 328,696,849 people shows a weak negative correlation between the proportion of Immigrants from Peru and median family income in the United States with a correlation coefficient (R) of -0.291 and weighted average of $103,534, a difference of 3.6%.
Spanish vs Immigrants from Peru Median Family Income

Median Family Income Correlation Summary

MeasurementSpanishImmigrants from Peru
Minimum$32,992$43,482
Maximum$127,945$176,625
Range$94,953$133,143
Mean$78,597$95,423
Median$75,704$98,015
Interquartile 25% (IQ1)$66,829$76,903
Interquartile 75% (IQ3)$90,296$108,609
Interquartile Range (IQR)$23,466$31,706
Standard Deviation (Sample)$17,174$22,960
Standard Deviation (Population)$17,054$22,846

Similar Demographics by Median Family Income

Demographics Similar to Spanish by Median Family Income

In terms of median family income, the demographic groups most similar to Spanish are Yugoslavian ($100,119, a difference of 0.14%), Immigrants from Thailand ($99,840, a difference of 0.14%), White/Caucasian ($99,800, a difference of 0.18%), Immigrants from Africa ($100,256, a difference of 0.28%), and Immigrants from Cameroon ($100,289, a difference of 0.31%).
DemographicsRating | RankMedian Family Income
Iraqis
26.3
/100
|
#193
Fair
$100,658
Uruguayans
26.3
/100
|
#194
Fair
$100,656
Immigrants | South America
23.9
/100
|
#195
Fair
$100,414
Samoans
23.3
/100
|
#196
Fair
$100,344
Immigrants | Cameroon
22.8
/100
|
#197
Fair
$100,289
Immigrants | Africa
22.5
/100
|
#198
Fair
$100,256
Yugoslavians
21.3
/100
|
#199
Fair
$100,119
Spanish
20.1
/100
|
#200
Fair
$99,977
Immigrants | Thailand
19.0
/100
|
#201
Poor
$99,840
Whites/Caucasians
18.7
/100
|
#202
Poor
$99,800
Scotch-Irish
17.1
/100
|
#203
Poor
$99,591
Ghanaians
12.6
/100
|
#204
Poor
$98,877
Hawaiians
12.5
/100
|
#205
Poor
$98,869
Immigrants | Iraq
12.1
/100
|
#206
Poor
$98,786
Aleuts
11.6
/100
|
#207
Poor
$98,702

Demographics Similar to Immigrants from Peru by Median Family Income

In terms of median family income, the demographic groups most similar to Immigrants from Peru are South American Indian ($103,624, a difference of 0.090%), English ($103,684, a difference of 0.15%), Slovak ($103,729, a difference of 0.19%), Czechoslovakian ($103,273, a difference of 0.25%), and Sierra Leonean ($103,859, a difference of 0.31%).
DemographicsRating | RankMedian Family Income
Icelanders
69.4
/100
|
#161
Good
$104,282
Immigrants | Sierra Leone
66.2
/100
|
#162
Good
$103,990
Costa Ricans
66.2
/100
|
#163
Good
$103,989
Sierra Leoneans
64.7
/100
|
#164
Good
$103,859
Slovaks
63.1
/100
|
#165
Good
$103,729
English
62.6
/100
|
#166
Good
$103,684
South American Indians
61.9
/100
|
#167
Good
$103,624
Immigrants | Peru
60.8
/100
|
#168
Good
$103,534
Czechoslovakians
57.6
/100
|
#169
Average
$103,273
Immigrants | Uzbekistan
56.6
/100
|
#170
Average
$103,197
Alsatians
54.3
/100
|
#171
Average
$103,010
Immigrants | Eritrea
51.9
/100
|
#172
Average
$102,823
Belgians
51.4
/100
|
#173
Average
$102,788
Finns
50.0
/100
|
#174
Average
$102,676
Immigrants | Eastern Africa
47.1
/100
|
#175
Average
$102,451