Guamanian/Chamorro vs Immigrants from Peru Householder Income Ages 45 - 64 years
COMPARE
Guamanian/Chamorro
Immigrants from Peru
Householder Income Ages 45 - 64 years
Householder Income Ages 45 - 64 years Comparison
Guamanians/Chamorros
Immigrants from Peru
$101,170
HOUSEHOLDER INCOME AGES 45 - 64 YEARS
60.5/ 100
METRIC RATING
169th/ 347
METRIC RANK
$103,173
HOUSEHOLDER INCOME AGES 45 - 64 YEARS
80.7/ 100
METRIC RATING
150th/ 347
METRIC RANK
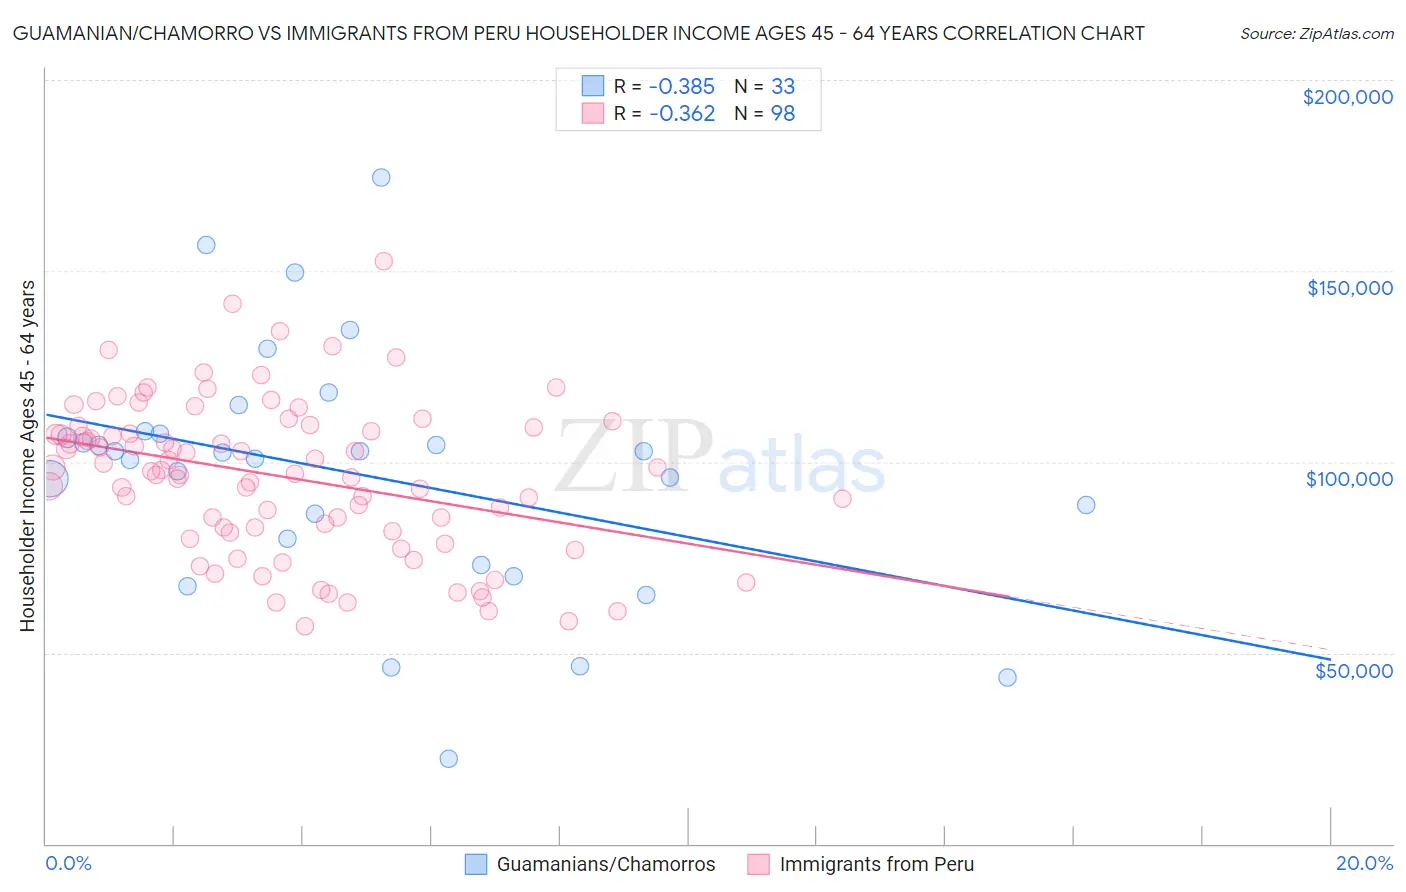
Guamanian/Chamorro vs Immigrants from Peru Householder Income Ages 45 - 64 years Correlation Chart
The statistical analysis conducted on geographies consisting of 221,751,742 people shows a mild negative correlation between the proportion of Guamanians/Chamorros and household income with householder between the ages 45 and 64 in the United States with a correlation coefficient (R) of -0.385 and weighted average of $101,170. Similarly, the statistical analysis conducted on geographies consisting of 328,568,384 people shows a mild negative correlation between the proportion of Immigrants from Peru and household income with householder between the ages 45 and 64 in the United States with a correlation coefficient (R) of -0.362 and weighted average of $103,173, a difference of 2.0%.
Householder Income Ages 45 - 64 years Correlation Summary
| Measurement | Guamanian/Chamorro | Immigrants from Peru |
| Minimum | $22,381 | $56,875 |
| Maximum | $174,529 | $152,612 |
| Range | $152,148 | $95,737 |
| Mean | $97,072 | $96,084 |
| Median | $102,408 | $97,801 |
| Interquartile 25% (IQ1) | $76,408 | $81,677 |
| Interquartile 75% (IQ3) | $107,629 | $109,063 |
| Interquartile Range (IQR) | $31,221 | $27,386 |
| Standard Deviation (Sample) | $32,320 | $20,026 |
| Standard Deviation (Population) | $31,826 | $19,924 |
Demographics Similar to Guamanians/Chamorros and Immigrants from Peru by Householder Income Ages 45 - 64 years
In terms of householder income ages 45 - 64 years, the demographic groups most similar to Guamanians/Chamorros are South American Indian ($101,171, a difference of 0.0%), Czechoslovakian ($101,387, a difference of 0.21%), Samoan ($101,580, a difference of 0.41%), Immigrants from Albania ($101,957, a difference of 0.78%), and Immigrants from Morocco ($102,015, a difference of 0.83%). Similarly, the demographic groups most similar to Immigrants from Peru are Immigrants from Sierra Leone ($103,227, a difference of 0.050%), Swiss ($103,071, a difference of 0.10%), Irish ($103,067, a difference of 0.10%), Scandinavian ($102,969, a difference of 0.20%), and Slovene ($102,885, a difference of 0.28%).
| Demographics | Rating | Rank | Householder Income Ages 45 - 64 years |
| Immigrants | Sierra Leone | 81.1 /100 | #149 | Excellent $103,227 |
| Immigrants | Peru | 80.7 /100 | #150 | Excellent $103,173 |
| Swiss | 79.9 /100 | #151 | Good $103,071 |
| Irish | 79.8 /100 | #152 | Good $103,067 |
| Scandinavians | 79.0 /100 | #153 | Good $102,969 |
| Slovenes | 78.3 /100 | #154 | Good $102,885 |
| Costa Ricans | 77.4 /100 | #155 | Good $102,779 |
| Carpatho Rusyns | 77.4 /100 | #156 | Good $102,777 |
| Immigrants | Ethiopia | 77.3 /100 | #157 | Good $102,763 |
| Slavs | 76.1 /100 | #158 | Good $102,629 |
| Sierra Leoneans | 74.2 /100 | #159 | Good $102,427 |
| Icelanders | 72.5 /100 | #160 | Good $102,261 |
| Immigrants | Nepal | 71.8 /100 | #161 | Good $102,190 |
| Scottish | 71.1 /100 | #162 | Good $102,123 |
| English | 70.1 /100 | #163 | Good $102,021 |
| Immigrants | Morocco | 70.0 /100 | #164 | Good $102,015 |
| Immigrants | Albania | 69.4 /100 | #165 | Good $101,957 |
| Samoans | 65.3 /100 | #166 | Good $101,580 |
| Czechoslovakians | 63.0 /100 | #167 | Good $101,387 |
| South American Indians | 60.5 /100 | #168 | Good $101,171 |
| Guamanians/Chamorros | 60.5 /100 | #169 | Good $101,170 |