Immigrants from Indonesia vs Immigrants from Peru Median Family Income
COMPARE
Immigrants from Indonesia
Immigrants from Peru
Median Family Income
Median Family Income Comparison
Immigrants from Indonesia
Immigrants from Peru
$115,162
MEDIAN FAMILY INCOME
99.8/ 100
METRIC RATING
58th/ 347
METRIC RANK
$103,534
MEDIAN FAMILY INCOME
60.8/ 100
METRIC RATING
168th/ 347
METRIC RANK
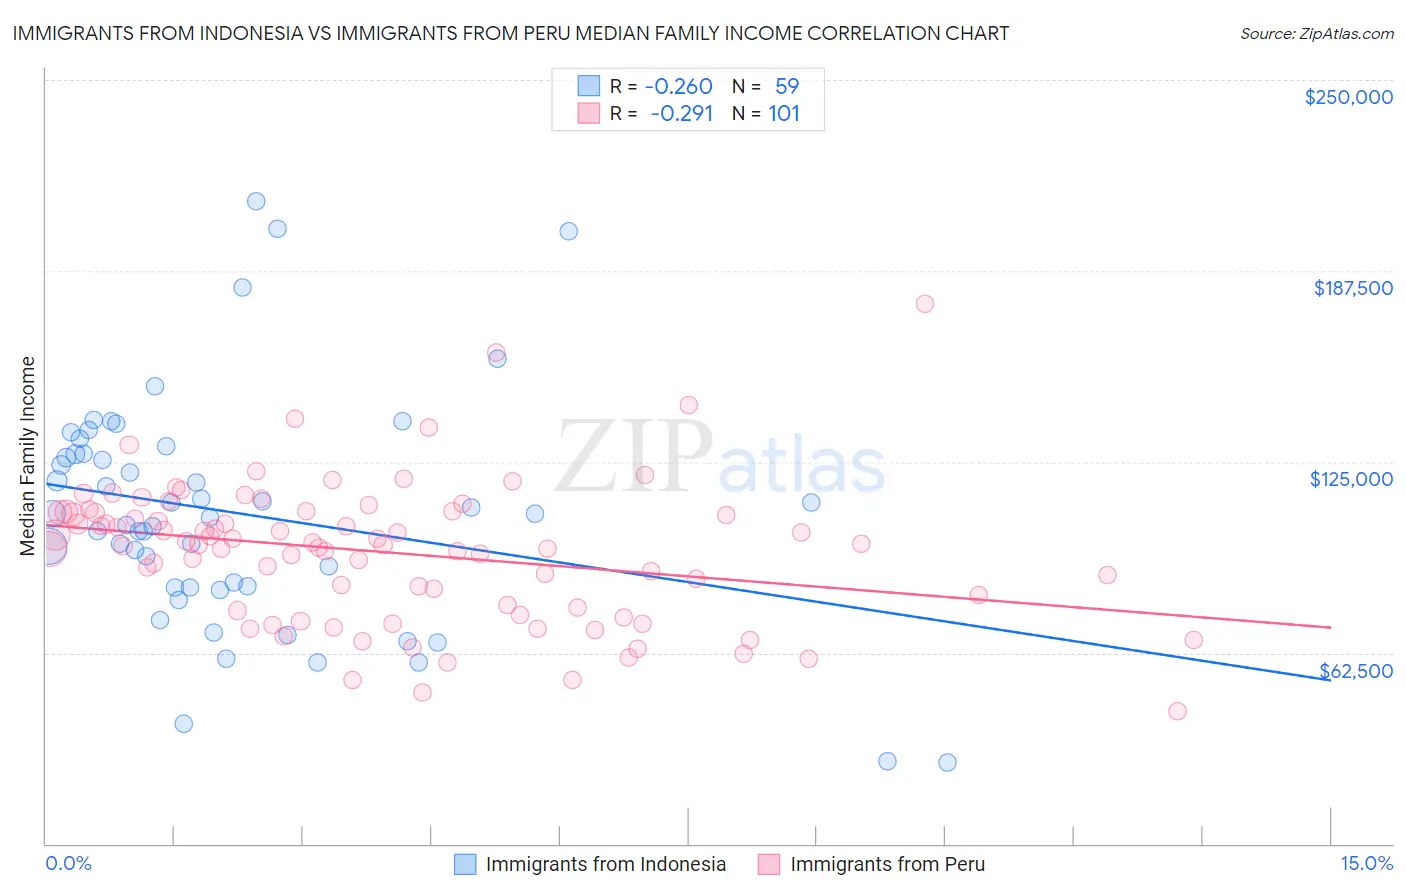
Immigrants from Indonesia vs Immigrants from Peru Median Family Income Correlation Chart
The statistical analysis conducted on geographies consisting of 215,683,063 people shows a weak negative correlation between the proportion of Immigrants from Indonesia and median family income in the United States with a correlation coefficient (R) of -0.260 and weighted average of $115,162. Similarly, the statistical analysis conducted on geographies consisting of 328,696,849 people shows a weak negative correlation between the proportion of Immigrants from Peru and median family income in the United States with a correlation coefficient (R) of -0.291 and weighted average of $103,534, a difference of 11.2%.
Median Family Income Correlation Summary
| Measurement | Immigrants from Indonesia | Immigrants from Peru |
| Minimum | $26,694 | $43,482 |
| Maximum | $210,375 | $176,625 |
| Range | $183,681 | $133,143 |
| Mean | $108,164 | $95,423 |
| Median | $108,113 | $98,015 |
| Interquartile 25% (IQ1) | $84,077 | $76,903 |
| Interquartile 75% (IQ3) | $127,666 | $108,609 |
| Interquartile Range (IQR) | $43,589 | $31,706 |
| Standard Deviation (Sample) | $37,920 | $22,960 |
| Standard Deviation (Population) | $37,598 | $22,846 |
Similar Demographics by Median Family Income
Demographics Similar to Immigrants from Indonesia by Median Family Income
In terms of median family income, the demographic groups most similar to Immigrants from Indonesia are Greek ($115,192, a difference of 0.030%), New Zealander ($115,230, a difference of 0.060%), Immigrants from Netherlands ($114,987, a difference of 0.15%), Lithuanian ($115,395, a difference of 0.20%), and Immigrants from Latvia ($114,826, a difference of 0.29%).
| Demographics | Rating | Rank | Median Family Income |
| Immigrants | Malaysia | 99.9 /100 | #51 | Exceptional $115,880 |
| Maltese | 99.9 /100 | #52 | Exceptional $115,862 |
| Immigrants | Norway | 99.9 /100 | #53 | Exceptional $115,847 |
| Immigrants | Europe | 99.9 /100 | #54 | Exceptional $115,523 |
| Lithuanians | 99.8 /100 | #55 | Exceptional $115,395 |
| New Zealanders | 99.8 /100 | #56 | Exceptional $115,230 |
| Greeks | 99.8 /100 | #57 | Exceptional $115,192 |
| Immigrants | Indonesia | 99.8 /100 | #58 | Exceptional $115,162 |
| Immigrants | Netherlands | 99.8 /100 | #59 | Exceptional $114,987 |
| Immigrants | Latvia | 99.8 /100 | #60 | Exceptional $114,826 |
| Immigrants | Belarus | 99.8 /100 | #61 | Exceptional $114,586 |
| Mongolians | 99.8 /100 | #62 | Exceptional $114,553 |
| Immigrants | Pakistan | 99.8 /100 | #63 | Exceptional $114,406 |
| Immigrants | Scotland | 99.7 /100 | #64 | Exceptional $114,392 |
| Egyptians | 99.7 /100 | #65 | Exceptional $114,119 |
Demographics Similar to Immigrants from Peru by Median Family Income
In terms of median family income, the demographic groups most similar to Immigrants from Peru are South American Indian ($103,624, a difference of 0.090%), English ($103,684, a difference of 0.15%), Slovak ($103,729, a difference of 0.19%), Czechoslovakian ($103,273, a difference of 0.25%), and Sierra Leonean ($103,859, a difference of 0.31%).
| Demographics | Rating | Rank | Median Family Income |
| Icelanders | 69.4 /100 | #161 | Good $104,282 |
| Immigrants | Sierra Leone | 66.2 /100 | #162 | Good $103,990 |
| Costa Ricans | 66.2 /100 | #163 | Good $103,989 |
| Sierra Leoneans | 64.7 /100 | #164 | Good $103,859 |
| Slovaks | 63.1 /100 | #165 | Good $103,729 |
| English | 62.6 /100 | #166 | Good $103,684 |
| South American Indians | 61.9 /100 | #167 | Good $103,624 |
| Immigrants | Peru | 60.8 /100 | #168 | Good $103,534 |
| Czechoslovakians | 57.6 /100 | #169 | Average $103,273 |
| Immigrants | Uzbekistan | 56.6 /100 | #170 | Average $103,197 |
| Alsatians | 54.3 /100 | #171 | Average $103,010 |
| Immigrants | Eritrea | 51.9 /100 | #172 | Average $102,823 |
| Belgians | 51.4 /100 | #173 | Average $102,788 |
| Finns | 50.0 /100 | #174 | Average $102,676 |
| Immigrants | Eastern Africa | 47.1 /100 | #175 | Average $102,451 |