Guamanian/Chamorro vs Spanish American Indian Median Family Income
COMPARE
Guamanian/Chamorro
Spanish American Indian
Median Family Income
Median Family Income Comparison
Guamanians/Chamorros
Spanish American Indians
$101,061
MEDIAN FAMILY INCOME
30.5/ 100
METRIC RATING
188th/ 347
METRIC RANK
$85,728
MEDIAN FAMILY INCOME
0.0/ 100
METRIC RATING
302nd/ 347
METRIC RANK
Guamanian/Chamorro vs Spanish American Indian Median Family Income Correlation Chart
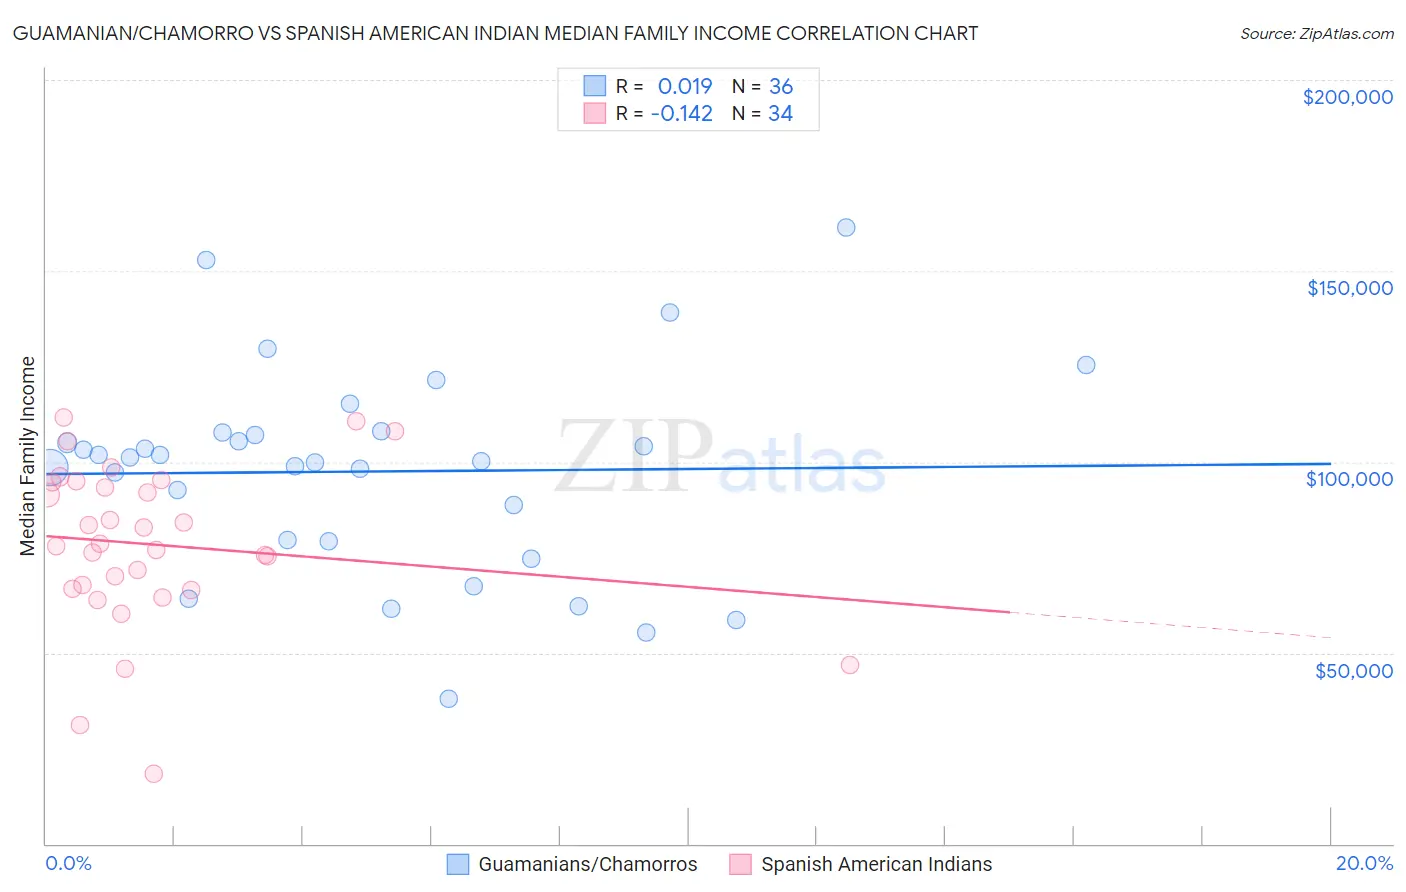
The statistical analysis conducted on geographies consisting of 221,859,912 people shows no correlation between the proportion of Guamanians/Chamorros and median family income in the United States with a correlation coefficient (R) of 0.019 and weighted average of $101,061. Similarly, the statistical analysis conducted on geographies consisting of 73,144,470 people shows a poor negative correlation between the proportion of Spanish American Indians and median family income in the United States with a correlation coefficient (R) of -0.142 and weighted average of $85,728, a difference of 17.9%.
Median Family Income Correlation Summary
| Measurement | Guamanian/Chamorro | Spanish American Indian |
| Minimum | $37,991 | $18,487 |
| Maximum | $161,250 | $111,586 |
| Range | $123,259 | $93,099 |
| Mean | $97,460 | $78,286 |
| Median | $100,672 | $78,276 |
| Interquartile 25% (IQ1) | $79,398 | $66,839 |
| Interquartile 75% (IQ3) | $107,355 | $94,568 |
| Interquartile Range (IQR) | $27,957 | $27,730 |
| Standard Deviation (Sample) | $26,595 | $21,408 |
| Standard Deviation (Population) | $26,223 | $21,091 |
Similar Demographics by Median Family Income
Demographics Similar to Guamanians/Chamorros by Median Family Income
In terms of median family income, the demographic groups most similar to Guamanians/Chamorros are Tlingit-Haida ($101,092, a difference of 0.030%), Celtic ($101,139, a difference of 0.080%), Immigrants from Portugal ($100,984, a difference of 0.080%), Immigrants ($100,962, a difference of 0.10%), and Dutch ($101,192, a difference of 0.13%).
| Demographics | Rating | Rank | Median Family Income |
| Spaniards | 36.8 /100 | #181 | Fair $101,617 |
| Tsimshian | 35.9 /100 | #182 | Fair $101,543 |
| Kenyans | 34.5 /100 | #183 | Fair $101,417 |
| Immigrants | Costa Rica | 33.7 /100 | #184 | Fair $101,354 |
| Dutch | 31.9 /100 | #185 | Fair $101,192 |
| Celtics | 31.3 /100 | #186 | Fair $101,139 |
| Tlingit-Haida | 30.8 /100 | #187 | Fair $101,092 |
| Guamanians/Chamorros | 30.5 /100 | #188 | Fair $101,061 |
| Immigrants | Portugal | 29.6 /100 | #189 | Fair $100,984 |
| Immigrants | Immigrants | 29.4 /100 | #190 | Fair $100,962 |
| Colombians | 27.2 /100 | #191 | Fair $100,750 |
| Immigrants | Kenya | 26.5 /100 | #192 | Fair $100,679 |
| Iraqis | 26.3 /100 | #193 | Fair $100,658 |
| Uruguayans | 26.3 /100 | #194 | Fair $100,656 |
| Immigrants | South America | 23.9 /100 | #195 | Fair $100,414 |
Demographics Similar to Spanish American Indians by Median Family Income
In terms of median family income, the demographic groups most similar to Spanish American Indians are Colville ($85,792, a difference of 0.070%), Hispanic or Latino ($85,647, a difference of 0.090%), Mexican ($85,618, a difference of 0.13%), Paiute ($85,414, a difference of 0.37%), and Immigrants from Dominica ($85,411, a difference of 0.37%).
| Demographics | Rating | Rank | Median Family Income |
| Yaqui | 0.0 /100 | #295 | Tragic $87,289 |
| Immigrants | Guatemala | 0.0 /100 | #296 | Tragic $87,191 |
| Cajuns | 0.0 /100 | #297 | Tragic $87,157 |
| Immigrants | Latin America | 0.0 /100 | #298 | Tragic $86,989 |
| Chippewa | 0.0 /100 | #299 | Tragic $86,852 |
| Ottawa | 0.0 /100 | #300 | Tragic $86,380 |
| Colville | 0.0 /100 | #301 | Tragic $85,792 |
| Spanish American Indians | 0.0 /100 | #302 | Tragic $85,728 |
| Hispanics or Latinos | 0.0 /100 | #303 | Tragic $85,647 |
| Mexicans | 0.0 /100 | #304 | Tragic $85,618 |
| Paiute | 0.0 /100 | #305 | Tragic $85,414 |
| Immigrants | Dominica | 0.0 /100 | #306 | Tragic $85,411 |
| Chickasaw | 0.0 /100 | #307 | Tragic $85,356 |
| U.S. Virgin Islanders | 0.0 /100 | #308 | Tragic $85,294 |
| Haitians | 0.0 /100 | #309 | Tragic $85,218 |