Guamanian/Chamorro vs Eastern European Median Family Income
COMPARE
Guamanian/Chamorro
Eastern European
Median Family Income
Median Family Income Comparison
Guamanians/Chamorros
Eastern Europeans
$101,061
MEDIAN FAMILY INCOME
30.5/ 100
METRIC RATING
188th/ 347
METRIC RANK
$125,546
MEDIAN FAMILY INCOME
100.0/ 100
METRIC RATING
15th/ 347
METRIC RANK
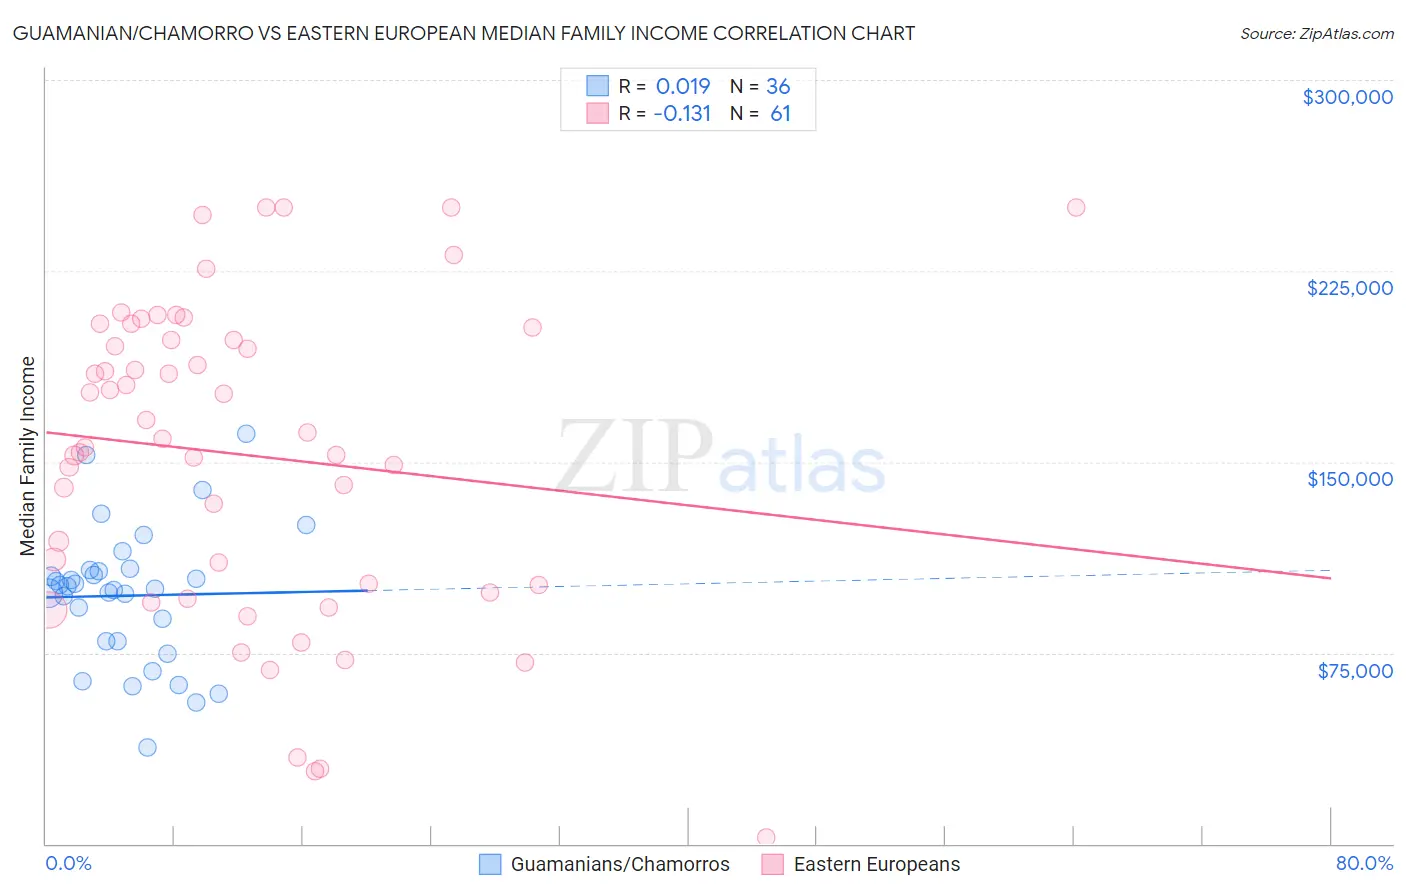
Guamanian/Chamorro vs Eastern European Median Family Income Correlation Chart
The statistical analysis conducted on geographies consisting of 221,859,912 people shows no correlation between the proportion of Guamanians/Chamorros and median family income in the United States with a correlation coefficient (R) of 0.019 and weighted average of $101,061. Similarly, the statistical analysis conducted on geographies consisting of 460,782,256 people shows a poor negative correlation between the proportion of Eastern Europeans and median family income in the United States with a correlation coefficient (R) of -0.131 and weighted average of $125,546, a difference of 24.2%.
Median Family Income Correlation Summary
| Measurement | Guamanian/Chamorro | Eastern European |
| Minimum | $37,991 | $2,499 |
| Maximum | $161,250 | $250,001 |
| Range | $123,259 | $247,502 |
| Mean | $97,460 | $152,671 |
| Median | $100,672 | $158,974 |
| Interquartile 25% (IQ1) | $79,398 | $100,360 |
| Interquartile 75% (IQ3) | $107,355 | $200,154 |
| Interquartile Range (IQR) | $27,957 | $99,794 |
| Standard Deviation (Sample) | $26,595 | $61,552 |
| Standard Deviation (Population) | $26,223 | $61,045 |
Similar Demographics by Median Family Income
Demographics Similar to Guamanians/Chamorros by Median Family Income
In terms of median family income, the demographic groups most similar to Guamanians/Chamorros are Tlingit-Haida ($101,092, a difference of 0.030%), Celtic ($101,139, a difference of 0.080%), Immigrants from Portugal ($100,984, a difference of 0.080%), Immigrants ($100,962, a difference of 0.10%), and Dutch ($101,192, a difference of 0.13%).
| Demographics | Rating | Rank | Median Family Income |
| Spaniards | 36.8 /100 | #181 | Fair $101,617 |
| Tsimshian | 35.9 /100 | #182 | Fair $101,543 |
| Kenyans | 34.5 /100 | #183 | Fair $101,417 |
| Immigrants | Costa Rica | 33.7 /100 | #184 | Fair $101,354 |
| Dutch | 31.9 /100 | #185 | Fair $101,192 |
| Celtics | 31.3 /100 | #186 | Fair $101,139 |
| Tlingit-Haida | 30.8 /100 | #187 | Fair $101,092 |
| Guamanians/Chamorros | 30.5 /100 | #188 | Fair $101,061 |
| Immigrants | Portugal | 29.6 /100 | #189 | Fair $100,984 |
| Immigrants | Immigrants | 29.4 /100 | #190 | Fair $100,962 |
| Colombians | 27.2 /100 | #191 | Fair $100,750 |
| Immigrants | Kenya | 26.5 /100 | #192 | Fair $100,679 |
| Iraqis | 26.3 /100 | #193 | Fair $100,658 |
| Uruguayans | 26.3 /100 | #194 | Fair $100,656 |
| Immigrants | South America | 23.9 /100 | #195 | Fair $100,414 |
Demographics Similar to Eastern Europeans by Median Family Income
In terms of median family income, the demographic groups most similar to Eastern Europeans are Immigrants from China ($125,540, a difference of 0.0%), Indian (Asian) ($125,312, a difference of 0.19%), Immigrants from Eastern Asia ($125,150, a difference of 0.32%), Immigrants from South Central Asia ($125,956, a difference of 0.33%), and Immigrants from Australia ($126,620, a difference of 0.86%).
| Demographics | Rating | Rank | Median Family Income |
| Immigrants | Iran | 100.0 /100 | #8 | Exceptional $130,894 |
| Okinawans | 100.0 /100 | #9 | Exceptional $129,979 |
| Immigrants | Ireland | 100.0 /100 | #10 | Exceptional $127,584 |
| Immigrants | Israel | 100.0 /100 | #11 | Exceptional $127,430 |
| Cypriots | 100.0 /100 | #12 | Exceptional $127,064 |
| Immigrants | Australia | 100.0 /100 | #13 | Exceptional $126,620 |
| Immigrants | South Central Asia | 100.0 /100 | #14 | Exceptional $125,956 |
| Eastern Europeans | 100.0 /100 | #15 | Exceptional $125,546 |
| Immigrants | China | 100.0 /100 | #16 | Exceptional $125,540 |
| Indians (Asian) | 100.0 /100 | #17 | Exceptional $125,312 |
| Immigrants | Eastern Asia | 100.0 /100 | #18 | Exceptional $125,150 |
| Immigrants | Belgium | 100.0 /100 | #19 | Exceptional $123,831 |
| Burmese | 100.0 /100 | #20 | Exceptional $123,369 |
| Immigrants | Korea | 100.0 /100 | #21 | Exceptional $122,800 |
| Immigrants | Sweden | 100.0 /100 | #22 | Exceptional $122,765 |