Senegalese vs Immigrants from Middle Africa Median Family Income
COMPARE
Senegalese
Immigrants from Middle Africa
Median Family Income
Median Family Income Comparison
Senegalese
Immigrants from Middle Africa
$91,475
MEDIAN FAMILY INCOME
0.3/ 100
METRIC RATING
264th/ 347
METRIC RANK
$93,593
MEDIAN FAMILY INCOME
1.0/ 100
METRIC RATING
245th/ 347
METRIC RANK
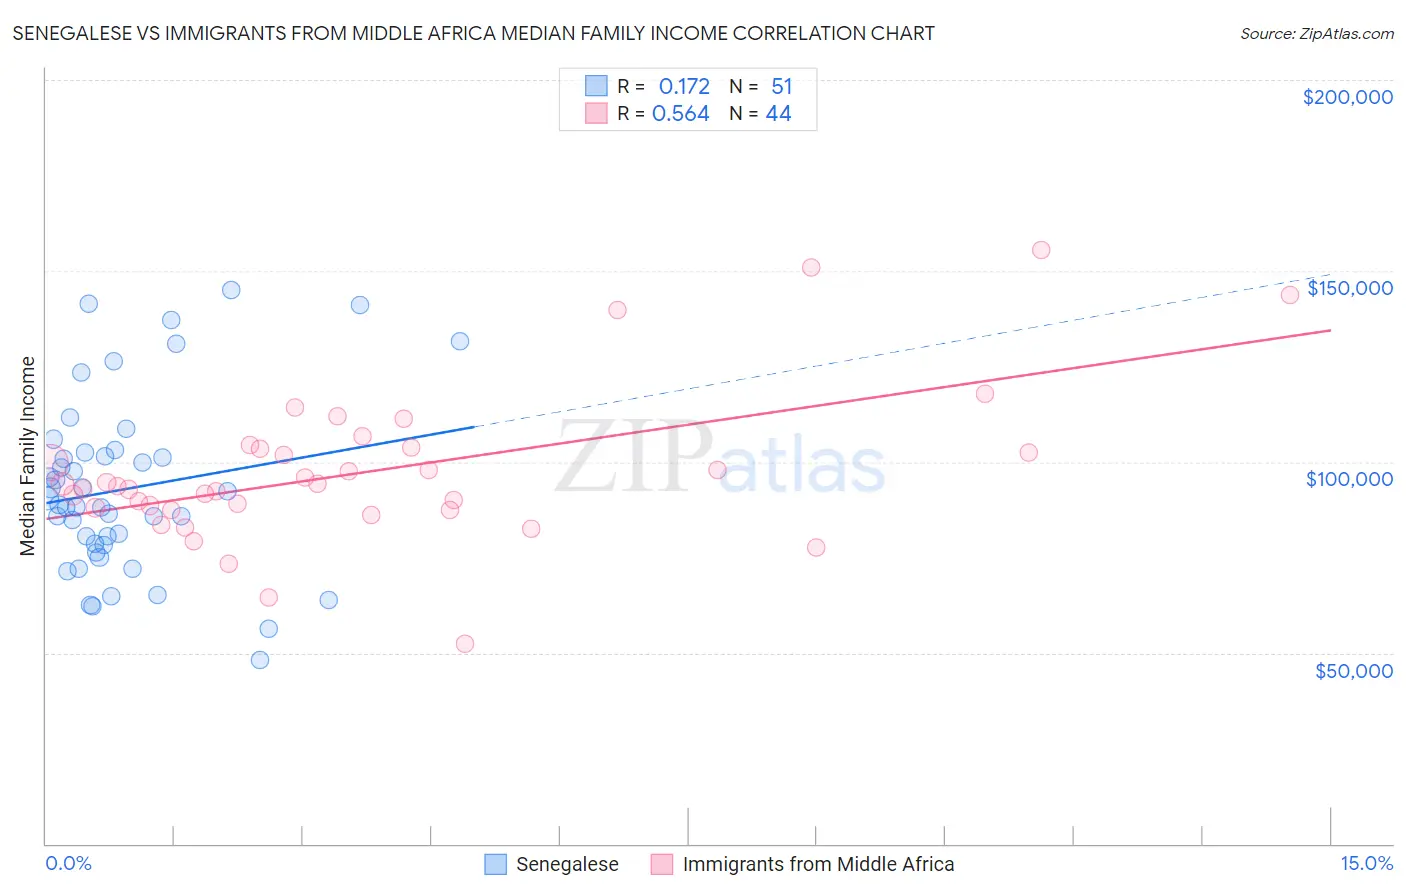
Senegalese vs Immigrants from Middle Africa Median Family Income Correlation Chart
The statistical analysis conducted on geographies consisting of 78,068,441 people shows a poor positive correlation between the proportion of Senegalese and median family income in the United States with a correlation coefficient (R) of 0.172 and weighted average of $91,475. Similarly, the statistical analysis conducted on geographies consisting of 202,625,103 people shows a substantial positive correlation between the proportion of Immigrants from Middle Africa and median family income in the United States with a correlation coefficient (R) of 0.564 and weighted average of $93,593, a difference of 2.3%.
Median Family Income Correlation Summary
| Measurement | Senegalese | Immigrants from Middle Africa |
| Minimum | $48,125 | $52,432 |
| Maximum | $145,000 | $155,375 |
| Range | $96,875 | $102,943 |
| Mean | $92,900 | $97,654 |
| Median | $88,669 | $93,999 |
| Interquartile 25% (IQ1) | $78,308 | $87,639 |
| Interquartile 75% (IQ3) | $102,554 | $103,622 |
| Interquartile Range (IQR) | $24,246 | $15,984 |
| Standard Deviation (Sample) | $22,975 | $20,164 |
| Standard Deviation (Population) | $22,749 | $19,934 |
Demographics Similar to Senegalese and Immigrants from Middle Africa by Median Family Income
In terms of median family income, the demographic groups most similar to Senegalese are Immigrants from West Indies ($91,588, a difference of 0.12%), Liberian ($91,722, a difference of 0.27%), Inupiat ($91,730, a difference of 0.28%), Pennsylvania German ($91,763, a difference of 0.31%), and Cape Verdean ($91,848, a difference of 0.41%). Similarly, the demographic groups most similar to Immigrants from Middle Africa are Subsaharan African ($93,748, a difference of 0.17%), Guyanese ($93,373, a difference of 0.23%), Immigrants from Senegal ($92,912, a difference of 0.73%), French American Indian ($92,872, a difference of 0.78%), and Immigrants from Ecuador ($92,837, a difference of 0.81%).
| Demographics | Rating | Rank | Median Family Income |
| Sub-Saharan Africans | 1.0 /100 | #244 | Tragic $93,748 |
| Immigrants | Middle Africa | 1.0 /100 | #245 | Tragic $93,593 |
| Guyanese | 0.9 /100 | #246 | Tragic $93,373 |
| Immigrants | Senegal | 0.7 /100 | #247 | Tragic $92,912 |
| French American Indians | 0.7 /100 | #248 | Tragic $92,872 |
| Immigrants | Ecuador | 0.7 /100 | #249 | Tragic $92,837 |
| West Indians | 0.6 /100 | #250 | Tragic $92,765 |
| Immigrants | Somalia | 0.6 /100 | #251 | Tragic $92,609 |
| Immigrants | El Salvador | 0.6 /100 | #252 | Tragic $92,545 |
| Immigrants | Guyana | 0.6 /100 | #253 | Tragic $92,513 |
| Immigrants | Barbados | 0.5 /100 | #254 | Tragic $92,419 |
| Immigrants | Laos | 0.5 /100 | #255 | Tragic $92,239 |
| Nicaraguans | 0.5 /100 | #256 | Tragic $92,231 |
| Americans | 0.4 /100 | #257 | Tragic $92,096 |
| Osage | 0.4 /100 | #258 | Tragic $91,926 |
| Cape Verdeans | 0.4 /100 | #259 | Tragic $91,848 |
| Pennsylvania Germans | 0.4 /100 | #260 | Tragic $91,763 |
| Inupiat | 0.4 /100 | #261 | Tragic $91,730 |
| Liberians | 0.4 /100 | #262 | Tragic $91,722 |
| Immigrants | West Indies | 0.3 /100 | #263 | Tragic $91,588 |
| Senegalese | 0.3 /100 | #264 | Tragic $91,475 |