Fijian vs Immigrants from Middle Africa Median Family Income
COMPARE
Fijian
Immigrants from Middle Africa
Median Family Income
Median Family Income Comparison
Fijians
Immigrants from Middle Africa
$87,387
MEDIAN FAMILY INCOME
0.0/ 100
METRIC RATING
294th/ 347
METRIC RANK
$93,593
MEDIAN FAMILY INCOME
1.0/ 100
METRIC RATING
245th/ 347
METRIC RANK
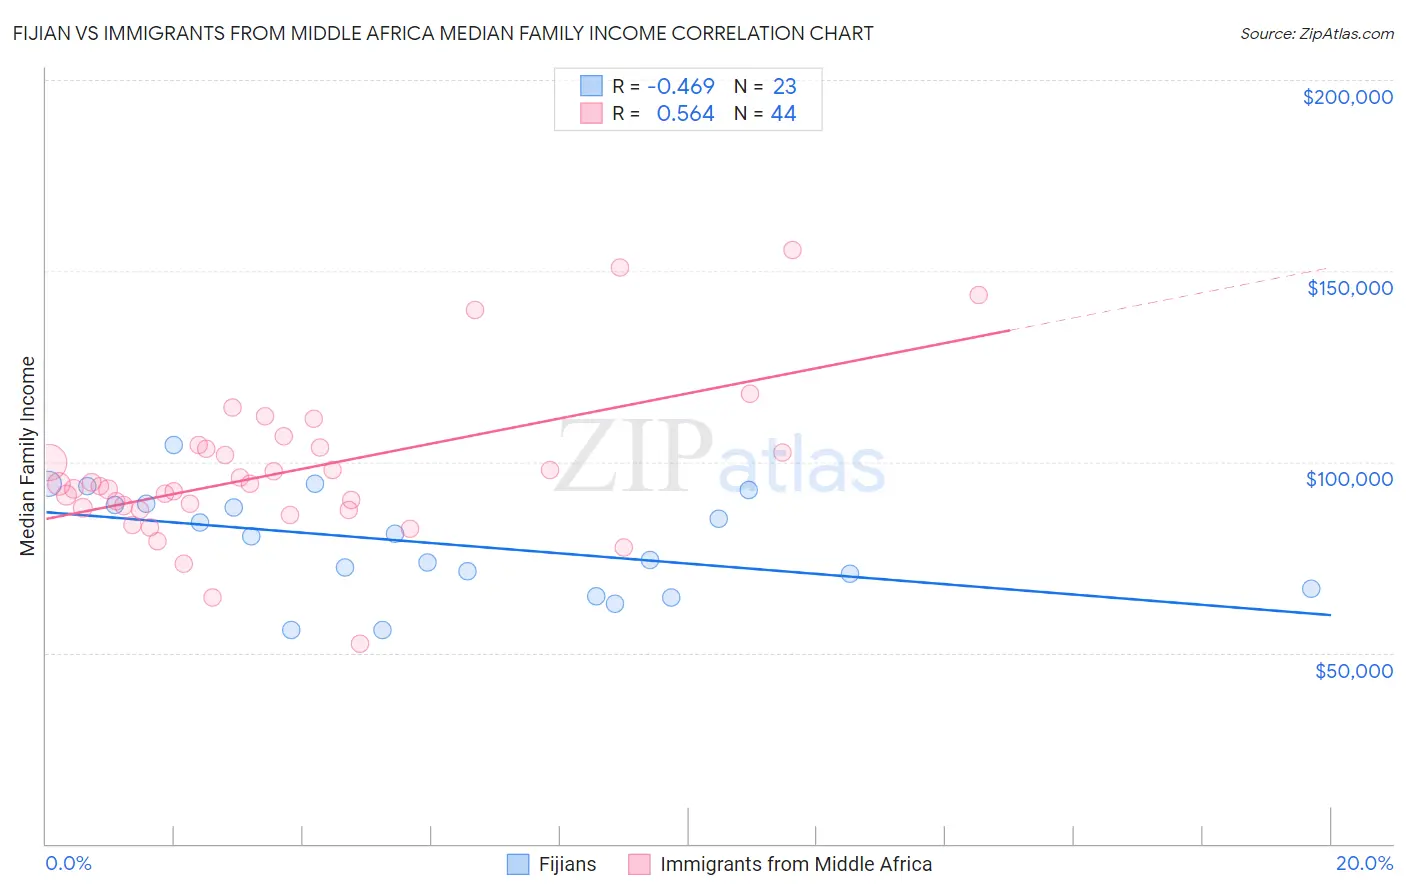
Fijian vs Immigrants from Middle Africa Median Family Income Correlation Chart
The statistical analysis conducted on geographies consisting of 55,946,812 people shows a moderate negative correlation between the proportion of Fijians and median family income in the United States with a correlation coefficient (R) of -0.469 and weighted average of $87,387. Similarly, the statistical analysis conducted on geographies consisting of 202,625,103 people shows a substantial positive correlation between the proportion of Immigrants from Middle Africa and median family income in the United States with a correlation coefficient (R) of 0.564 and weighted average of $93,593, a difference of 7.1%.
Median Family Income Correlation Summary
| Measurement | Fijian | Immigrants from Middle Africa |
| Minimum | $55,821 | $52,432 |
| Maximum | $104,335 | $155,375 |
| Range | $48,514 | $102,943 |
| Mean | $78,636 | $97,654 |
| Median | $80,363 | $93,999 |
| Interquartile 25% (IQ1) | $66,750 | $87,639 |
| Interquartile 75% (IQ3) | $89,066 | $103,622 |
| Interquartile Range (IQR) | $22,316 | $15,984 |
| Standard Deviation (Sample) | $13,442 | $20,164 |
| Standard Deviation (Population) | $13,146 | $19,934 |
Similar Demographics by Median Family Income
Demographics Similar to Fijians by Median Family Income
In terms of median family income, the demographic groups most similar to Fijians are Yaqui ($87,289, a difference of 0.11%), Immigrants from Guatemala ($87,191, a difference of 0.22%), Ute ($87,596, a difference of 0.24%), Cajun ($87,157, a difference of 0.26%), and Immigrants from Latin America ($86,989, a difference of 0.46%).
| Demographics | Rating | Rank | Median Family Income |
| Potawatomi | 0.1 /100 | #287 | Tragic $88,265 |
| Cherokee | 0.1 /100 | #288 | Tragic $88,209 |
| Central American Indians | 0.1 /100 | #289 | Tragic $88,034 |
| Shoshone | 0.1 /100 | #290 | Tragic $87,872 |
| Immigrants | Cabo Verde | 0.1 /100 | #291 | Tragic $87,830 |
| Africans | 0.1 /100 | #292 | Tragic $87,820 |
| Ute | 0.0 /100 | #293 | Tragic $87,596 |
| Fijians | 0.0 /100 | #294 | Tragic $87,387 |
| Yaqui | 0.0 /100 | #295 | Tragic $87,289 |
| Immigrants | Guatemala | 0.0 /100 | #296 | Tragic $87,191 |
| Cajuns | 0.0 /100 | #297 | Tragic $87,157 |
| Immigrants | Latin America | 0.0 /100 | #298 | Tragic $86,989 |
| Chippewa | 0.0 /100 | #299 | Tragic $86,852 |
| Ottawa | 0.0 /100 | #300 | Tragic $86,380 |
| Colville | 0.0 /100 | #301 | Tragic $85,792 |
Demographics Similar to Immigrants from Middle Africa by Median Family Income
In terms of median family income, the demographic groups most similar to Immigrants from Middle Africa are Subsaharan African ($93,748, a difference of 0.17%), Guyanese ($93,373, a difference of 0.23%), German Russian ($93,858, a difference of 0.28%), Barbadian ($93,919, a difference of 0.35%), and Immigrants from Trinidad and Tobago ($93,988, a difference of 0.42%).
| Demographics | Rating | Rank | Median Family Income |
| Nepalese | 1.3 /100 | #238 | Tragic $94,153 |
| Salvadorans | 1.2 /100 | #239 | Tragic $94,109 |
| Somalis | 1.2 /100 | #240 | Tragic $94,085 |
| Immigrants | Trinidad and Tobago | 1.2 /100 | #241 | Tragic $93,988 |
| Barbadians | 1.1 /100 | #242 | Tragic $93,919 |
| German Russians | 1.1 /100 | #243 | Tragic $93,858 |
| Sub-Saharan Africans | 1.0 /100 | #244 | Tragic $93,748 |
| Immigrants | Middle Africa | 1.0 /100 | #245 | Tragic $93,593 |
| Guyanese | 0.9 /100 | #246 | Tragic $93,373 |
| Immigrants | Senegal | 0.7 /100 | #247 | Tragic $92,912 |
| French American Indians | 0.7 /100 | #248 | Tragic $92,872 |
| Immigrants | Ecuador | 0.7 /100 | #249 | Tragic $92,837 |
| West Indians | 0.6 /100 | #250 | Tragic $92,765 |
| Immigrants | Somalia | 0.6 /100 | #251 | Tragic $92,609 |
| Immigrants | El Salvador | 0.6 /100 | #252 | Tragic $92,545 |