Arapaho vs Immigrants from Middle Africa Median Family Income
COMPARE
Arapaho
Immigrants from Middle Africa
Median Family Income
Median Family Income Comparison
Arapaho
Immigrants from Middle Africa
$82,064
MEDIAN FAMILY INCOME
0.0/ 100
METRIC RATING
327th/ 347
METRIC RANK
$93,593
MEDIAN FAMILY INCOME
1.0/ 100
METRIC RATING
245th/ 347
METRIC RANK
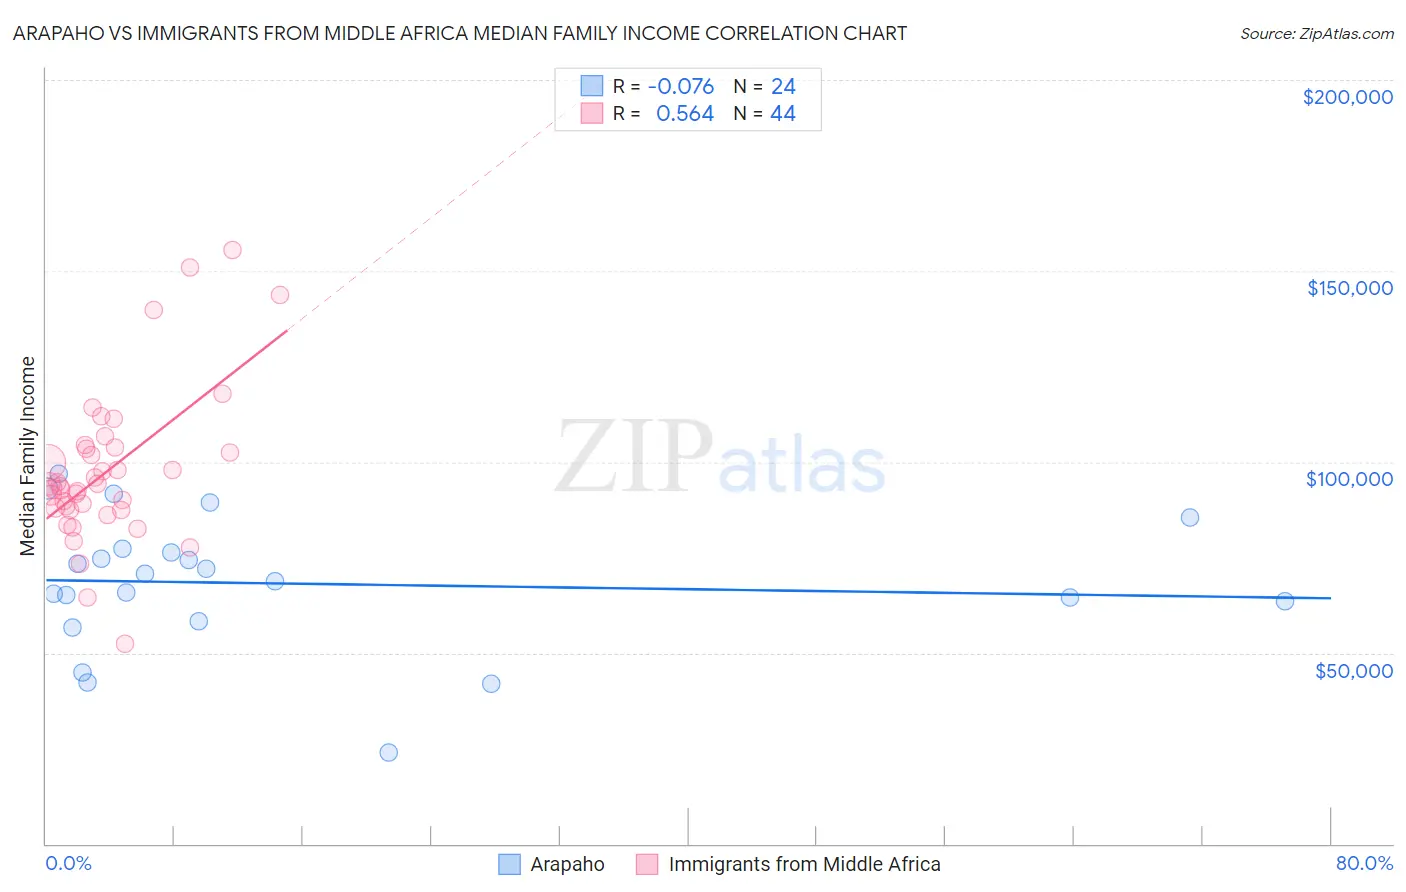
Arapaho vs Immigrants from Middle Africa Median Family Income Correlation Chart
The statistical analysis conducted on geographies consisting of 29,776,303 people shows a slight negative correlation between the proportion of Arapaho and median family income in the United States with a correlation coefficient (R) of -0.076 and weighted average of $82,064. Similarly, the statistical analysis conducted on geographies consisting of 202,625,103 people shows a substantial positive correlation between the proportion of Immigrants from Middle Africa and median family income in the United States with a correlation coefficient (R) of 0.564 and weighted average of $93,593, a difference of 14.1%.
Median Family Income Correlation Summary
| Measurement | Arapaho | Immigrants from Middle Africa |
| Minimum | $23,750 | $52,432 |
| Maximum | $96,782 | $155,375 |
| Range | $73,032 | $102,943 |
| Mean | $68,152 | $97,654 |
| Median | $69,777 | $93,999 |
| Interquartile 25% (IQ1) | $60,858 | $87,639 |
| Interquartile 75% (IQ3) | $76,786 | $103,622 |
| Interquartile Range (IQR) | $15,928 | $15,984 |
| Standard Deviation (Sample) | $17,667 | $20,164 |
| Standard Deviation (Population) | $17,295 | $19,934 |
Similar Demographics by Median Family Income
Demographics Similar to Arapaho by Median Family Income
In terms of median family income, the demographic groups most similar to Arapaho are Black/African American ($81,912, a difference of 0.18%), Immigrants from Congo ($82,216, a difference of 0.19%), Dutch West Indian ($81,852, a difference of 0.26%), Sioux ($82,386, a difference of 0.39%), and Creek ($82,560, a difference of 0.61%).
| Demographics | Rating | Rank | Median Family Income |
| Seminole | 0.0 /100 | #320 | Tragic $83,354 |
| Immigrants | Caribbean | 0.0 /100 | #321 | Tragic $83,319 |
| Dominicans | 0.0 /100 | #322 | Tragic $82,888 |
| Bahamians | 0.0 /100 | #323 | Tragic $82,631 |
| Creek | 0.0 /100 | #324 | Tragic $82,560 |
| Sioux | 0.0 /100 | #325 | Tragic $82,386 |
| Immigrants | Congo | 0.0 /100 | #326 | Tragic $82,216 |
| Arapaho | 0.0 /100 | #327 | Tragic $82,064 |
| Blacks/African Americans | 0.0 /100 | #328 | Tragic $81,912 |
| Dutch West Indians | 0.0 /100 | #329 | Tragic $81,852 |
| Cheyenne | 0.0 /100 | #330 | Tragic $81,385 |
| Immigrants | Dominican Republic | 0.0 /100 | #331 | Tragic $81,233 |
| Natives/Alaskans | 0.0 /100 | #332 | Tragic $80,908 |
| Kiowa | 0.0 /100 | #333 | Tragic $80,885 |
| Menominee | 0.0 /100 | #334 | Tragic $79,563 |
Demographics Similar to Immigrants from Middle Africa by Median Family Income
In terms of median family income, the demographic groups most similar to Immigrants from Middle Africa are Subsaharan African ($93,748, a difference of 0.17%), Guyanese ($93,373, a difference of 0.23%), German Russian ($93,858, a difference of 0.28%), Barbadian ($93,919, a difference of 0.35%), and Immigrants from Trinidad and Tobago ($93,988, a difference of 0.42%).
| Demographics | Rating | Rank | Median Family Income |
| Nepalese | 1.3 /100 | #238 | Tragic $94,153 |
| Salvadorans | 1.2 /100 | #239 | Tragic $94,109 |
| Somalis | 1.2 /100 | #240 | Tragic $94,085 |
| Immigrants | Trinidad and Tobago | 1.2 /100 | #241 | Tragic $93,988 |
| Barbadians | 1.1 /100 | #242 | Tragic $93,919 |
| German Russians | 1.1 /100 | #243 | Tragic $93,858 |
| Sub-Saharan Africans | 1.0 /100 | #244 | Tragic $93,748 |
| Immigrants | Middle Africa | 1.0 /100 | #245 | Tragic $93,593 |
| Guyanese | 0.9 /100 | #246 | Tragic $93,373 |
| Immigrants | Senegal | 0.7 /100 | #247 | Tragic $92,912 |
| French American Indians | 0.7 /100 | #248 | Tragic $92,872 |
| Immigrants | Ecuador | 0.7 /100 | #249 | Tragic $92,837 |
| West Indians | 0.6 /100 | #250 | Tragic $92,765 |
| Immigrants | Somalia | 0.6 /100 | #251 | Tragic $92,609 |
| Immigrants | El Salvador | 0.6 /100 | #252 | Tragic $92,545 |