Guamanian/Chamorro vs Immigrants from Middle Africa Male Poverty
COMPARE
Guamanian/Chamorro
Immigrants from Middle Africa
Male Poverty
Male Poverty Comparison
Guamanians/Chamorros
Immigrants from Middle Africa
11.0%
MALE POVERTY
67.6/ 100
METRIC RATING
150th/ 347
METRIC RANK
12.7%
MALE POVERTY
0.4/ 100
METRIC RATING
240th/ 347
METRIC RANK
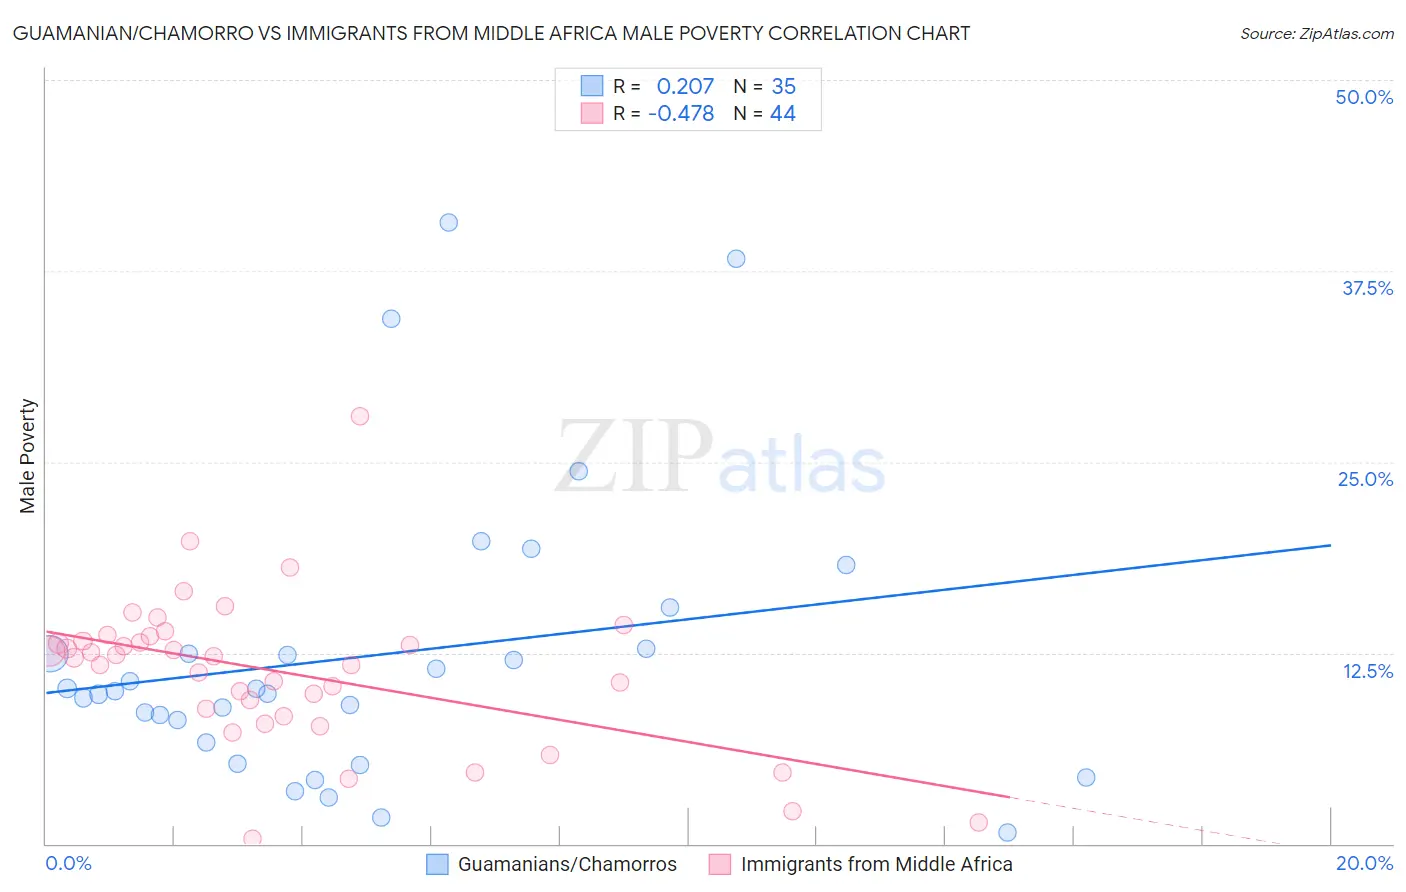
Guamanian/Chamorro vs Immigrants from Middle Africa Male Poverty Correlation Chart
The statistical analysis conducted on geographies consisting of 221,842,342 people shows a weak positive correlation between the proportion of Guamanians/Chamorros and poverty level among males in the United States with a correlation coefficient (R) of 0.207 and weighted average of 11.0%. Similarly, the statistical analysis conducted on geographies consisting of 202,607,111 people shows a moderate negative correlation between the proportion of Immigrants from Middle Africa and poverty level among males in the United States with a correlation coefficient (R) of -0.478 and weighted average of 12.7%, a difference of 15.8%.
Male Poverty Correlation Summary
| Measurement | Guamanian/Chamorro | Immigrants from Middle Africa |
| Minimum | 0.76% | 0.33% |
| Maximum | 40.6% | 28.0% |
| Range | 39.9% | 27.6% |
| Mean | 12.3% | 11.3% |
| Median | 10.0% | 12.3% |
| Interquartile 25% (IQ1) | 6.6% | 8.6% |
| Interquartile 75% (IQ3) | 12.7% | 13.4% |
| Interquartile Range (IQR) | 6.1% | 4.9% |
| Standard Deviation (Sample) | 9.5% | 5.0% |
| Standard Deviation (Population) | 9.3% | 4.9% |
Similar Demographics by Male Poverty
Demographics Similar to Guamanians/Chamorros by Male Poverty
In terms of male poverty, the demographic groups most similar to Guamanians/Chamorros are Venezuelan (11.0%, a difference of 0.020%), Immigrants from Nepal (11.0%, a difference of 0.030%), Immigrants from Venezuela (11.0%, a difference of 0.040%), Armenian (11.0%, a difference of 0.050%), and Icelander (11.0%, a difference of 0.11%).
| Demographics | Rating | Rank | Male Poverty |
| Afghans | 71.9 /100 | #143 | Good 10.9% |
| Samoans | 71.8 /100 | #144 | Good 10.9% |
| Immigrants | Germany | 71.6 /100 | #145 | Good 10.9% |
| Syrians | 71.4 /100 | #146 | Good 10.9% |
| Icelanders | 68.5 /100 | #147 | Good 11.0% |
| Armenians | 68.0 /100 | #148 | Good 11.0% |
| Immigrants | Venezuela | 67.9 /100 | #149 | Good 11.0% |
| Guamanians/Chamorros | 67.6 /100 | #150 | Good 11.0% |
| Venezuelans | 67.4 /100 | #151 | Good 11.0% |
| Immigrants | Nepal | 67.3 /100 | #152 | Good 11.0% |
| Immigrants | Bosnia and Herzegovina | 65.2 /100 | #153 | Good 11.0% |
| Immigrants | Kazakhstan | 64.8 /100 | #154 | Good 11.0% |
| Immigrants | Malaysia | 64.7 /100 | #155 | Good 11.0% |
| Costa Ricans | 63.9 /100 | #156 | Good 11.0% |
| Scotch-Irish | 63.7 /100 | #157 | Good 11.0% |
Demographics Similar to Immigrants from Middle Africa by Male Poverty
In terms of male poverty, the demographic groups most similar to Immigrants from Middle Africa are Ghanaian (12.7%, a difference of 0.27%), Ecuadorian (12.7%, a difference of 0.28%), French American Indian (12.7%, a difference of 0.31%), Immigrants from Saudi Arabia (12.7%, a difference of 0.35%), and Sudanese (12.8%, a difference of 0.36%).
| Demographics | Rating | Rank | Male Poverty |
| Fijians | 0.6 /100 | #233 | Tragic 12.6% |
| Immigrants | Armenia | 0.6 /100 | #234 | Tragic 12.6% |
| Immigrants | Laos | 0.5 /100 | #235 | Tragic 12.6% |
| Immigrants | Saudi Arabia | 0.4 /100 | #236 | Tragic 12.7% |
| French American Indians | 0.4 /100 | #237 | Tragic 12.7% |
| Ecuadorians | 0.4 /100 | #238 | Tragic 12.7% |
| Ghanaians | 0.4 /100 | #239 | Tragic 12.7% |
| Immigrants | Middle Africa | 0.4 /100 | #240 | Tragic 12.7% |
| Sudanese | 0.3 /100 | #241 | Tragic 12.8% |
| Nepalese | 0.3 /100 | #242 | Tragic 12.8% |
| Alaskan Athabascans | 0.3 /100 | #243 | Tragic 12.8% |
| Tsimshian | 0.3 /100 | #244 | Tragic 12.8% |
| Liberians | 0.3 /100 | #245 | Tragic 12.8% |
| Immigrants | El Salvador | 0.2 /100 | #246 | Tragic 12.8% |
| Immigrants | Western Africa | 0.2 /100 | #247 | Tragic 12.9% |