Yaqui vs Immigrants from Croatia Median Family Income
COMPARE
Yaqui
Immigrants from Croatia
Median Family Income
Median Family Income Comparison
Yaqui
Immigrants from Croatia
$87,289
MEDIAN FAMILY INCOME
0.0/ 100
METRIC RATING
295th/ 347
METRIC RANK
$112,323
MEDIAN FAMILY INCOME
99.3/ 100
METRIC RATING
80th/ 347
METRIC RANK
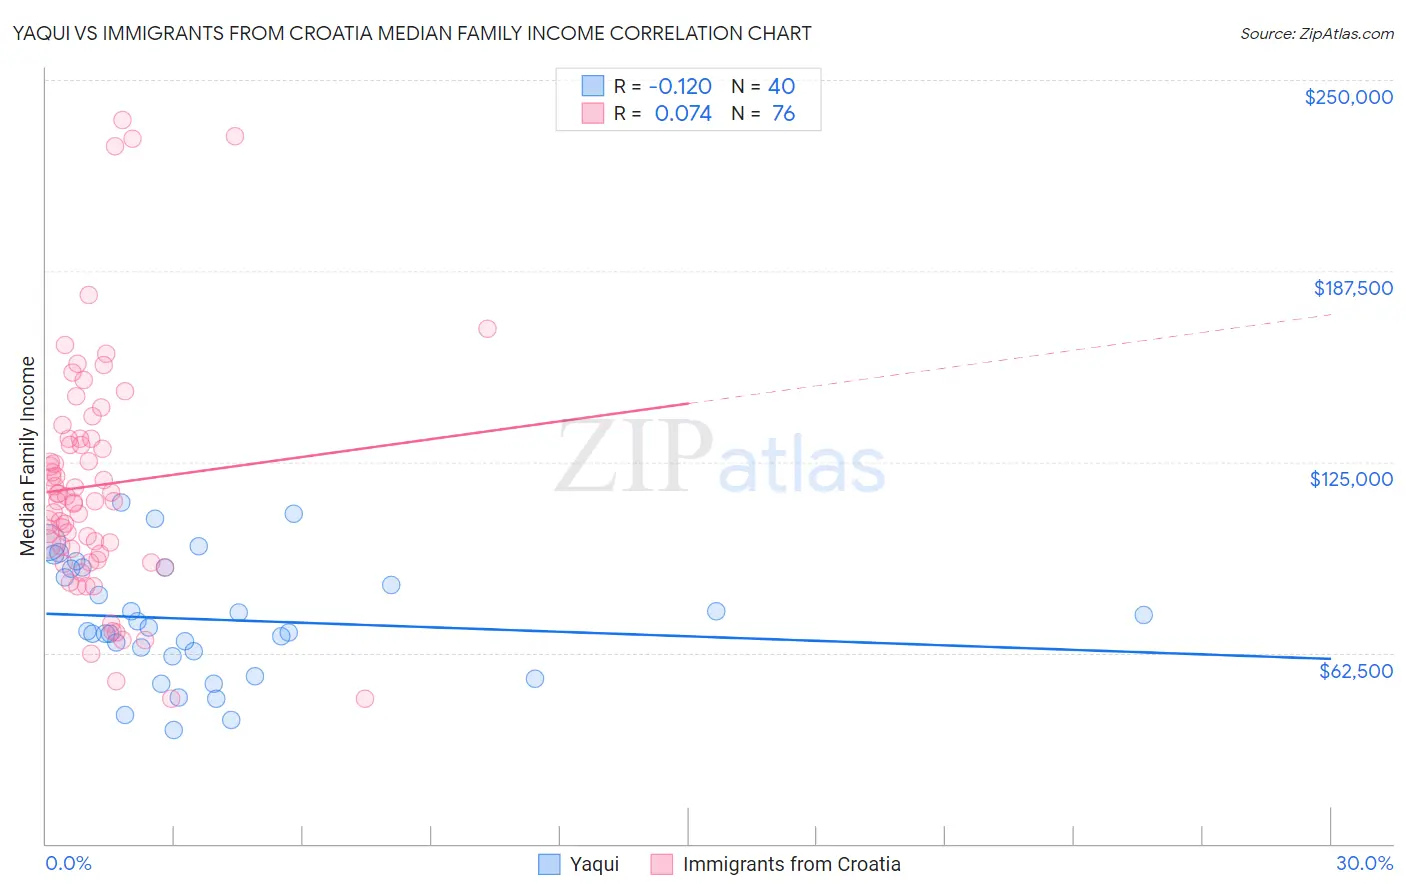
Yaqui vs Immigrants from Croatia Median Family Income Correlation Chart
The statistical analysis conducted on geographies consisting of 107,704,504 people shows a poor negative correlation between the proportion of Yaqui and median family income in the United States with a correlation coefficient (R) of -0.120 and weighted average of $87,289. Similarly, the statistical analysis conducted on geographies consisting of 132,566,402 people shows a slight positive correlation between the proportion of Immigrants from Croatia and median family income in the United States with a correlation coefficient (R) of 0.074 and weighted average of $112,323, a difference of 28.7%.
Median Family Income Correlation Summary
| Measurement | Yaqui | Immigrants from Croatia |
| Minimum | $37,174 | $47,321 |
| Maximum | $111,841 | $236,888 |
| Range | $74,667 | $189,567 |
| Mean | $73,462 | $117,325 |
| Median | $70,310 | $112,019 |
| Interquartile 25% (IQ1) | $62,336 | $93,889 |
| Interquartile 75% (IQ3) | $90,136 | $132,485 |
| Interquartile Range (IQR) | $27,800 | $38,596 |
| Standard Deviation (Sample) | $19,183 | $39,118 |
| Standard Deviation (Population) | $18,942 | $38,860 |
Similar Demographics by Median Family Income
Demographics Similar to Yaqui by Median Family Income
In terms of median family income, the demographic groups most similar to Yaqui are Fijian ($87,387, a difference of 0.11%), Immigrants from Guatemala ($87,191, a difference of 0.11%), Cajun ($87,157, a difference of 0.15%), Immigrants from Latin America ($86,989, a difference of 0.34%), and Ute ($87,596, a difference of 0.35%).
| Demographics | Rating | Rank | Median Family Income |
| Cherokee | 0.1 /100 | #288 | Tragic $88,209 |
| Central American Indians | 0.1 /100 | #289 | Tragic $88,034 |
| Shoshone | 0.1 /100 | #290 | Tragic $87,872 |
| Immigrants | Cabo Verde | 0.1 /100 | #291 | Tragic $87,830 |
| Africans | 0.1 /100 | #292 | Tragic $87,820 |
| Ute | 0.0 /100 | #293 | Tragic $87,596 |
| Fijians | 0.0 /100 | #294 | Tragic $87,387 |
| Yaqui | 0.0 /100 | #295 | Tragic $87,289 |
| Immigrants | Guatemala | 0.0 /100 | #296 | Tragic $87,191 |
| Cajuns | 0.0 /100 | #297 | Tragic $87,157 |
| Immigrants | Latin America | 0.0 /100 | #298 | Tragic $86,989 |
| Chippewa | 0.0 /100 | #299 | Tragic $86,852 |
| Ottawa | 0.0 /100 | #300 | Tragic $86,380 |
| Colville | 0.0 /100 | #301 | Tragic $85,792 |
| Spanish American Indians | 0.0 /100 | #302 | Tragic $85,728 |
Demographics Similar to Immigrants from Croatia by Median Family Income
In terms of median family income, the demographic groups most similar to Immigrants from Croatia are Italian ($112,372, a difference of 0.040%), Immigrants from Canada ($112,374, a difference of 0.050%), Immigrants from North America ($112,151, a difference of 0.15%), Immigrants from Eastern Europe ($112,527, a difference of 0.18%), and Immigrants from England ($112,038, a difference of 0.25%).
| Demographics | Rating | Rank | Median Family Income |
| Laotians | 99.5 /100 | #73 | Exceptional $112,859 |
| Immigrants | Italy | 99.4 /100 | #74 | Exceptional $112,848 |
| Immigrants | Western Europe | 99.4 /100 | #75 | Exceptional $112,688 |
| Argentineans | 99.4 /100 | #76 | Exceptional $112,665 |
| Immigrants | Eastern Europe | 99.4 /100 | #77 | Exceptional $112,527 |
| Immigrants | Canada | 99.3 /100 | #78 | Exceptional $112,374 |
| Italians | 99.3 /100 | #79 | Exceptional $112,372 |
| Immigrants | Croatia | 99.3 /100 | #80 | Exceptional $112,323 |
| Immigrants | North America | 99.2 /100 | #81 | Exceptional $112,151 |
| Immigrants | England | 99.2 /100 | #82 | Exceptional $112,038 |
| Immigrants | Egypt | 99.0 /100 | #83 | Exceptional $111,689 |
| Immigrants | Hungary | 98.8 /100 | #84 | Exceptional $111,378 |
| Croatians | 98.8 /100 | #85 | Exceptional $111,370 |
| Ukrainians | 98.8 /100 | #86 | Exceptional $111,368 |
| Austrians | 98.8 /100 | #87 | Exceptional $111,306 |