Greek vs Italian Median Male Earnings
COMPARE
Greek
Italian
Median Male Earnings
Median Male Earnings Comparison
Greeks
Italians
$61,242
MEDIAN MALE EARNINGS
99.9/ 100
METRIC RATING
55th/ 347
METRIC RANK
$59,551
MEDIAN MALE EARNINGS
99.3/ 100
METRIC RATING
85th/ 347
METRIC RANK
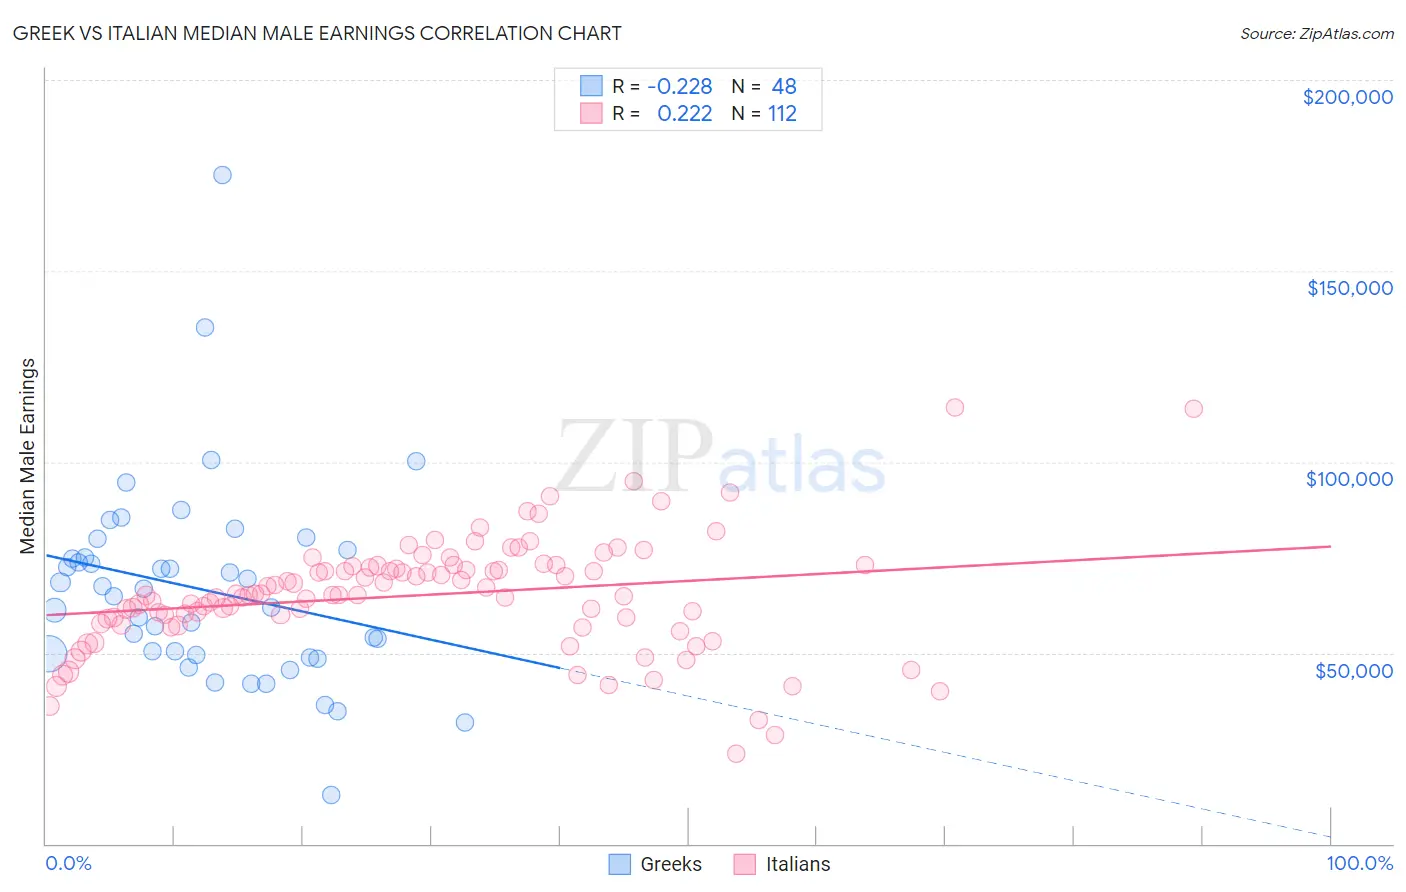
Greek vs Italian Median Male Earnings Correlation Chart
The statistical analysis conducted on geographies consisting of 482,499,684 people shows a weak negative correlation between the proportion of Greeks and median male earnings in the United States with a correlation coefficient (R) of -0.228 and weighted average of $61,242. Similarly, the statistical analysis conducted on geographies consisting of 573,649,793 people shows a weak positive correlation between the proportion of Italians and median male earnings in the United States with a correlation coefficient (R) of 0.222 and weighted average of $59,551, a difference of 2.8%.
Median Male Earnings Correlation Summary
| Measurement | Greek | Italian |
| Minimum | $12,679 | $23,704 |
| Maximum | $175,000 | $114,356 |
| Range | $162,321 | $90,652 |
| Mean | $66,512 | $65,064 |
| Median | $65,740 | $65,149 |
| Interquartile 25% (IQ1) | $49,612 | $58,270 |
| Interquartile 75% (IQ3) | $75,987 | $72,487 |
| Interquartile Range (IQR) | $26,375 | $14,217 |
| Standard Deviation (Sample) | $26,480 | $14,744 |
| Standard Deviation (Population) | $26,203 | $14,679 |
Similar Demographics by Median Male Earnings
Demographics Similar to Greeks by Median Male Earnings
In terms of median male earnings, the demographic groups most similar to Greeks are Lithuanian ($61,228, a difference of 0.020%), Immigrants from Scotland ($61,220, a difference of 0.040%), New Zealander ($61,199, a difference of 0.070%), Immigrants from Netherlands ($61,096, a difference of 0.24%), and Egyptian ($61,095, a difference of 0.24%).
| Demographics | Rating | Rank | Median Male Earnings |
| Immigrants | Malaysia | 99.9 /100 | #48 | Exceptional $62,121 |
| Immigrants | Europe | 99.9 /100 | #49 | Exceptional $62,057 |
| Bhutanese | 99.9 /100 | #50 | Exceptional $61,759 |
| Estonians | 99.9 /100 | #51 | Exceptional $61,710 |
| Immigrants | Norway | 99.9 /100 | #52 | Exceptional $61,628 |
| South Africans | 99.9 /100 | #53 | Exceptional $61,460 |
| Immigrants | Latvia | 99.9 /100 | #54 | Exceptional $61,422 |
| Greeks | 99.9 /100 | #55 | Exceptional $61,242 |
| Lithuanians | 99.9 /100 | #56 | Exceptional $61,228 |
| Immigrants | Scotland | 99.9 /100 | #57 | Exceptional $61,220 |
| New Zealanders | 99.9 /100 | #58 | Exceptional $61,199 |
| Immigrants | Netherlands | 99.8 /100 | #59 | Exceptional $61,096 |
| Egyptians | 99.8 /100 | #60 | Exceptional $61,095 |
| Bolivians | 99.8 /100 | #61 | Exceptional $61,066 |
| Immigrants | Romania | 99.8 /100 | #62 | Exceptional $61,040 |
Demographics Similar to Italians by Median Male Earnings
In terms of median male earnings, the demographic groups most similar to Italians are Afghan ($59,554, a difference of 0.0%), Immigrants from England ($59,527, a difference of 0.040%), Macedonian ($59,522, a difference of 0.050%), Immigrants from Argentina ($59,491, a difference of 0.10%), and Immigrants from Moldova ($59,417, a difference of 0.23%).
| Demographics | Rating | Rank | Median Male Earnings |
| Immigrants | Egypt | 99.5 /100 | #78 | Exceptional $59,925 |
| Immigrants | Ukraine | 99.5 /100 | #79 | Exceptional $59,820 |
| Immigrants | Hungary | 99.5 /100 | #80 | Exceptional $59,806 |
| Ukrainians | 99.4 /100 | #81 | Exceptional $59,728 |
| Croatians | 99.4 /100 | #82 | Exceptional $59,715 |
| Immigrants | Italy | 99.4 /100 | #83 | Exceptional $59,691 |
| Afghans | 99.3 /100 | #84 | Exceptional $59,554 |
| Italians | 99.3 /100 | #85 | Exceptional $59,551 |
| Immigrants | England | 99.3 /100 | #86 | Exceptional $59,527 |
| Macedonians | 99.3 /100 | #87 | Exceptional $59,522 |
| Immigrants | Argentina | 99.3 /100 | #88 | Exceptional $59,491 |
| Immigrants | Moldova | 99.2 /100 | #89 | Exceptional $59,417 |
| Austrians | 99.2 /100 | #90 | Exceptional $59,359 |
| Laotians | 99.2 /100 | #91 | Exceptional $59,351 |
| Immigrants | Kazakhstan | 99.1 /100 | #92 | Exceptional $59,278 |