Greek vs Ecuadorian Median Male Earnings
COMPARE
Greek
Ecuadorian
Median Male Earnings
Median Male Earnings Comparison
Greeks
Ecuadorians
$61,242
MEDIAN MALE EARNINGS
99.9/ 100
METRIC RATING
55th/ 347
METRIC RANK
$51,596
MEDIAN MALE EARNINGS
5.5/ 100
METRIC RATING
223rd/ 347
METRIC RANK
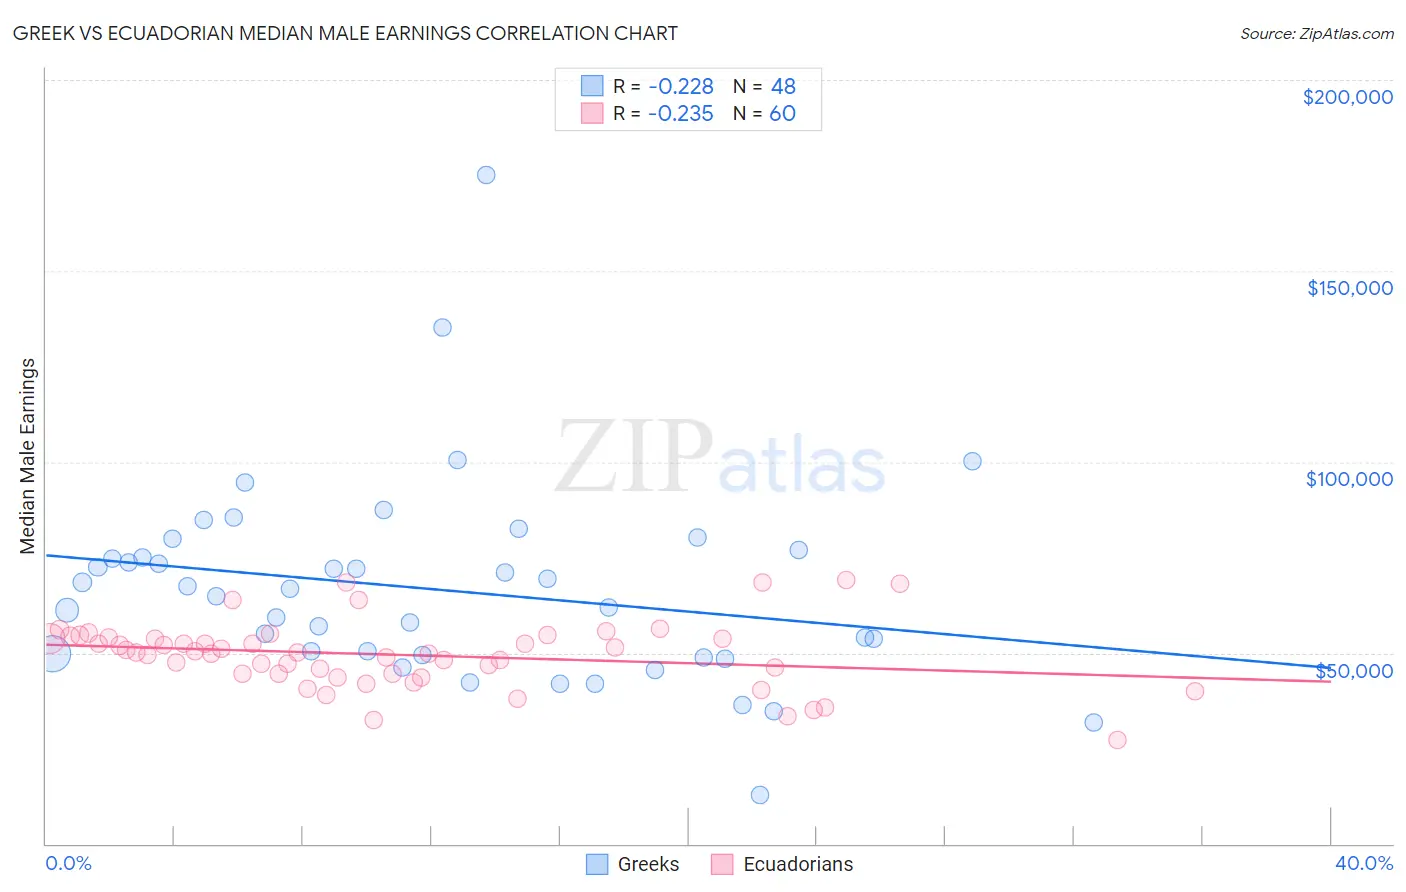
Greek vs Ecuadorian Median Male Earnings Correlation Chart
The statistical analysis conducted on geographies consisting of 482,499,684 people shows a weak negative correlation between the proportion of Greeks and median male earnings in the United States with a correlation coefficient (R) of -0.228 and weighted average of $61,242. Similarly, the statistical analysis conducted on geographies consisting of 317,782,884 people shows a weak negative correlation between the proportion of Ecuadorians and median male earnings in the United States with a correlation coefficient (R) of -0.235 and weighted average of $51,596, a difference of 18.7%.
Median Male Earnings Correlation Summary
| Measurement | Greek | Ecuadorian |
| Minimum | $12,679 | $27,125 |
| Maximum | $175,000 | $69,080 |
| Range | $162,321 | $41,955 |
| Mean | $66,512 | $49,474 |
| Median | $65,740 | $50,085 |
| Interquartile 25% (IQ1) | $49,612 | $44,427 |
| Interquartile 75% (IQ3) | $75,987 | $53,952 |
| Interquartile Range (IQR) | $26,375 | $9,525 |
| Standard Deviation (Sample) | $26,480 | $8,750 |
| Standard Deviation (Population) | $26,203 | $8,677 |
Similar Demographics by Median Male Earnings
Demographics Similar to Greeks by Median Male Earnings
In terms of median male earnings, the demographic groups most similar to Greeks are Lithuanian ($61,228, a difference of 0.020%), Immigrants from Scotland ($61,220, a difference of 0.040%), New Zealander ($61,199, a difference of 0.070%), Immigrants from Netherlands ($61,096, a difference of 0.24%), and Egyptian ($61,095, a difference of 0.24%).
| Demographics | Rating | Rank | Median Male Earnings |
| Immigrants | Malaysia | 99.9 /100 | #48 | Exceptional $62,121 |
| Immigrants | Europe | 99.9 /100 | #49 | Exceptional $62,057 |
| Bhutanese | 99.9 /100 | #50 | Exceptional $61,759 |
| Estonians | 99.9 /100 | #51 | Exceptional $61,710 |
| Immigrants | Norway | 99.9 /100 | #52 | Exceptional $61,628 |
| South Africans | 99.9 /100 | #53 | Exceptional $61,460 |
| Immigrants | Latvia | 99.9 /100 | #54 | Exceptional $61,422 |
| Greeks | 99.9 /100 | #55 | Exceptional $61,242 |
| Lithuanians | 99.9 /100 | #56 | Exceptional $61,228 |
| Immigrants | Scotland | 99.9 /100 | #57 | Exceptional $61,220 |
| New Zealanders | 99.9 /100 | #58 | Exceptional $61,199 |
| Immigrants | Netherlands | 99.8 /100 | #59 | Exceptional $61,096 |
| Egyptians | 99.8 /100 | #60 | Exceptional $61,095 |
| Bolivians | 99.8 /100 | #61 | Exceptional $61,066 |
| Immigrants | Romania | 99.8 /100 | #62 | Exceptional $61,040 |
Demographics Similar to Ecuadorians by Median Male Earnings
In terms of median male earnings, the demographic groups most similar to Ecuadorians are Immigrants from Cambodia ($51,594, a difference of 0.0%), Immigrants from Bangladesh ($51,642, a difference of 0.090%), Immigrants from Senegal ($51,647, a difference of 0.10%), Immigrants from Sudan ($51,489, a difference of 0.21%), and Japanese ($51,473, a difference of 0.24%).
| Demographics | Rating | Rank | Median Male Earnings |
| Immigrants | Venezuela | 8.3 /100 | #216 | Tragic $52,041 |
| Nigerians | 8.3 /100 | #217 | Tragic $52,039 |
| Immigrants | Panama | 7.7 /100 | #218 | Tragic $51,962 |
| Immigrants | Ghana | 6.9 /100 | #219 | Tragic $51,836 |
| Immigrants | Armenia | 6.6 /100 | #220 | Tragic $51,793 |
| Immigrants | Senegal | 5.8 /100 | #221 | Tragic $51,647 |
| Immigrants | Bangladesh | 5.8 /100 | #222 | Tragic $51,642 |
| Ecuadorians | 5.5 /100 | #223 | Tragic $51,596 |
| Immigrants | Cambodia | 5.5 /100 | #224 | Tragic $51,594 |
| Immigrants | Sudan | 5.0 /100 | #225 | Tragic $51,489 |
| Japanese | 4.9 /100 | #226 | Tragic $51,473 |
| Trinidadians and Tobagonians | 4.8 /100 | #227 | Tragic $51,446 |
| Samoans | 4.6 /100 | #228 | Tragic $51,389 |
| Immigrants | Trinidad and Tobago | 4.5 /100 | #229 | Tragic $51,376 |
| Immigrants | Nigeria | 4.2 /100 | #230 | Tragic $51,310 |