Greek vs Immigrants from North America Median Male Earnings
COMPARE
Greek
Immigrants from North America
Median Male Earnings
Median Male Earnings Comparison
Greeks
Immigrants from North America
$61,242
MEDIAN MALE EARNINGS
99.9/ 100
METRIC RATING
55th/ 347
METRIC RANK
$60,265
MEDIAN MALE EARNINGS
99.7/ 100
METRIC RATING
73rd/ 347
METRIC RANK
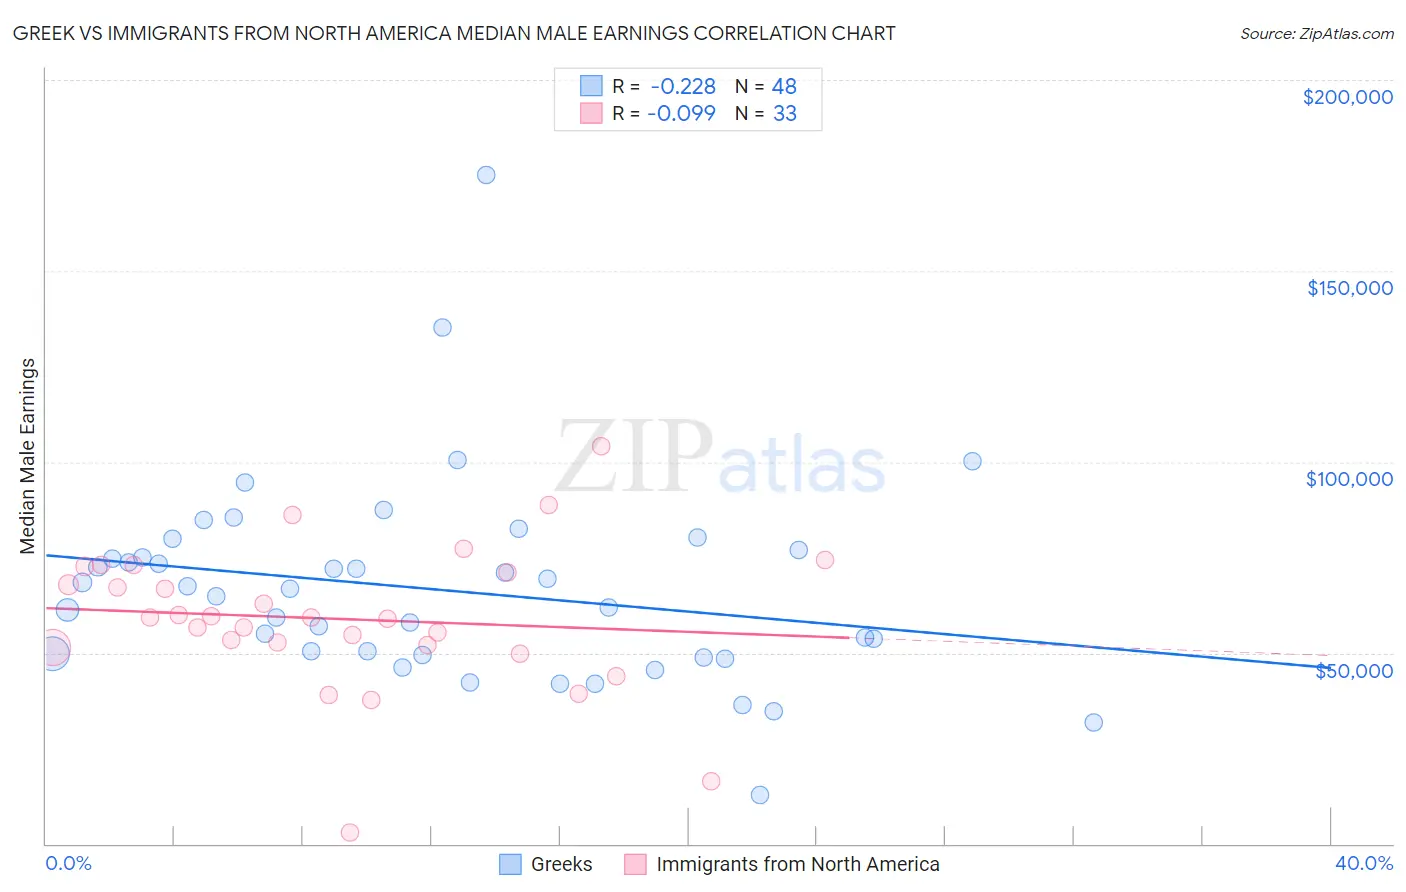
Greek vs Immigrants from North America Median Male Earnings Correlation Chart
The statistical analysis conducted on geographies consisting of 482,499,684 people shows a weak negative correlation between the proportion of Greeks and median male earnings in the United States with a correlation coefficient (R) of -0.228 and weighted average of $61,242. Similarly, the statistical analysis conducted on geographies consisting of 462,182,608 people shows a slight negative correlation between the proportion of Immigrants from North America and median male earnings in the United States with a correlation coefficient (R) of -0.099 and weighted average of $60,265, a difference of 1.6%.
Median Male Earnings Correlation Summary
| Measurement | Greek | Immigrants from North America |
| Minimum | $12,679 | $2,875 |
| Maximum | $175,000 | $104,091 |
| Range | $162,321 | $101,216 |
| Mean | $66,512 | $58,890 |
| Median | $65,740 | $59,220 |
| Interquartile 25% (IQ1) | $49,612 | $51,688 |
| Interquartile 75% (IQ3) | $75,987 | $71,762 |
| Interquartile Range (IQR) | $26,375 | $20,074 |
| Standard Deviation (Sample) | $26,480 | $19,290 |
| Standard Deviation (Population) | $26,203 | $18,995 |
Demographics Similar to Greeks and Immigrants from North America by Median Male Earnings
In terms of median male earnings, the demographic groups most similar to Greeks are Lithuanian ($61,228, a difference of 0.020%), Immigrants from Scotland ($61,220, a difference of 0.040%), New Zealander ($61,199, a difference of 0.070%), Immigrants from Netherlands ($61,096, a difference of 0.24%), and Egyptian ($61,095, a difference of 0.24%). Similarly, the demographic groups most similar to Immigrants from North America are Immigrants from Western Europe ($60,334, a difference of 0.12%), Mongolian ($60,350, a difference of 0.14%), Immigrants from Bulgaria ($60,358, a difference of 0.16%), Immigrants from Canada ($60,388, a difference of 0.20%), and Argentinean ($60,117, a difference of 0.25%).
| Demographics | Rating | Rank | Median Male Earnings |
| Immigrants | Latvia | 99.9 /100 | #54 | Exceptional $61,422 |
| Greeks | 99.9 /100 | #55 | Exceptional $61,242 |
| Lithuanians | 99.9 /100 | #56 | Exceptional $61,228 |
| Immigrants | Scotland | 99.9 /100 | #57 | Exceptional $61,220 |
| New Zealanders | 99.9 /100 | #58 | Exceptional $61,199 |
| Immigrants | Netherlands | 99.8 /100 | #59 | Exceptional $61,096 |
| Egyptians | 99.8 /100 | #60 | Exceptional $61,095 |
| Bolivians | 99.8 /100 | #61 | Exceptional $61,066 |
| Immigrants | Romania | 99.8 /100 | #62 | Exceptional $61,040 |
| Immigrants | Pakistan | 99.8 /100 | #63 | Exceptional $60,987 |
| Immigrants | Eastern Europe | 99.8 /100 | #64 | Exceptional $60,958 |
| Immigrants | Indonesia | 99.8 /100 | #65 | Exceptional $60,935 |
| Immigrants | Croatia | 99.8 /100 | #66 | Exceptional $60,914 |
| Immigrants | Spain | 99.8 /100 | #67 | Exceptional $60,750 |
| Immigrants | Serbia | 99.7 /100 | #68 | Exceptional $60,600 |
| Immigrants | Canada | 99.7 /100 | #69 | Exceptional $60,388 |
| Immigrants | Bulgaria | 99.7 /100 | #70 | Exceptional $60,358 |
| Mongolians | 99.7 /100 | #71 | Exceptional $60,350 |
| Immigrants | Western Europe | 99.7 /100 | #72 | Exceptional $60,334 |
| Immigrants | North America | 99.7 /100 | #73 | Exceptional $60,265 |
| Argentineans | 99.6 /100 | #74 | Exceptional $60,117 |