Greek vs Immigrants from Korea Median Male Earnings
COMPARE
Greek
Immigrants from Korea
Median Male Earnings
Median Male Earnings Comparison
Greeks
Immigrants from Korea
$61,242
MEDIAN MALE EARNINGS
99.9/ 100
METRIC RATING
55th/ 347
METRIC RANK
$65,079
MEDIAN MALE EARNINGS
100.0/ 100
METRIC RATING
23rd/ 347
METRIC RANK
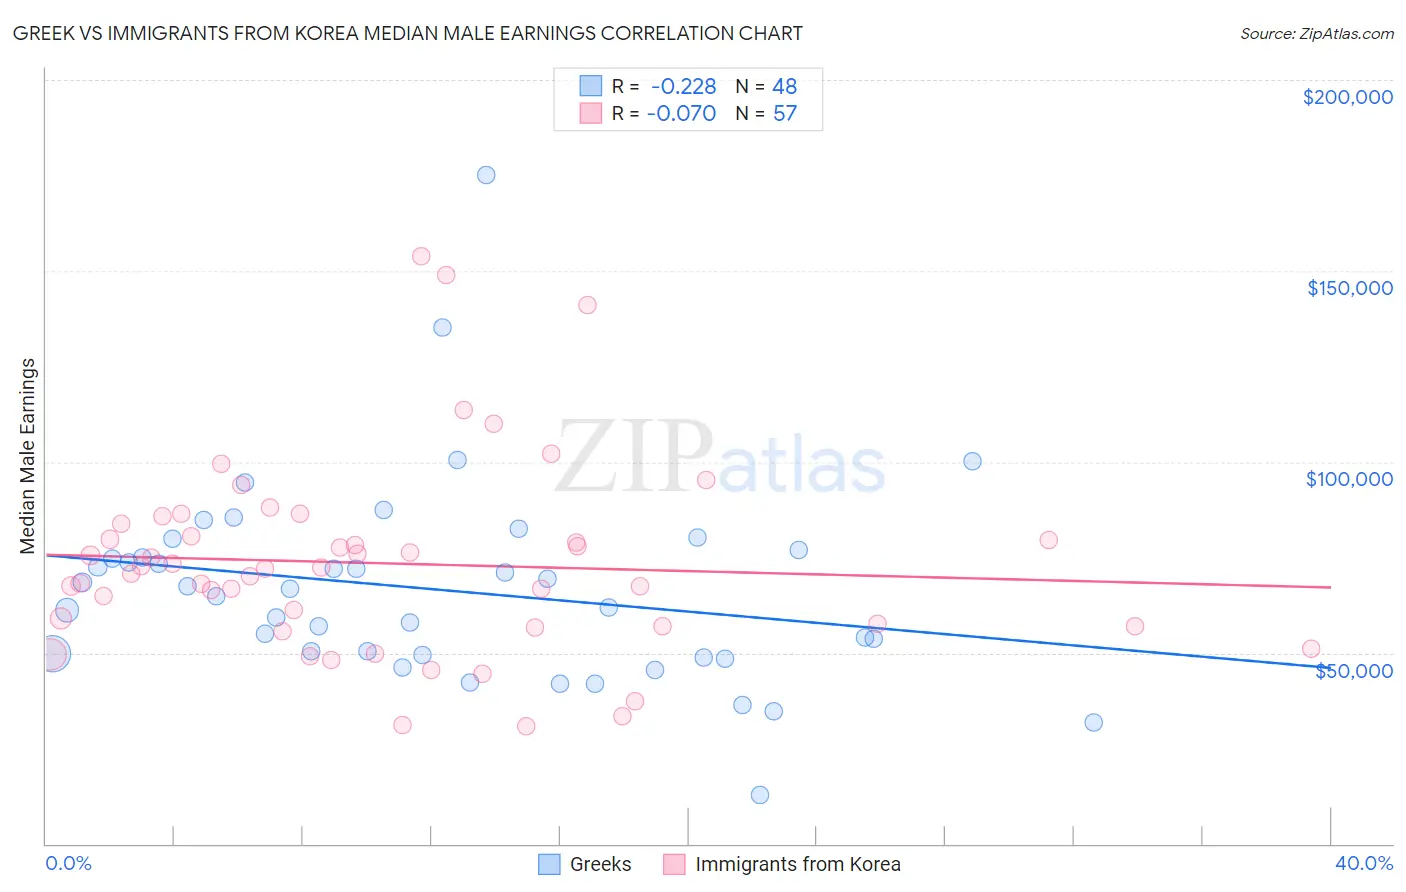
Greek vs Immigrants from Korea Median Male Earnings Correlation Chart
The statistical analysis conducted on geographies consisting of 482,499,684 people shows a weak negative correlation between the proportion of Greeks and median male earnings in the United States with a correlation coefficient (R) of -0.228 and weighted average of $61,242. Similarly, the statistical analysis conducted on geographies consisting of 416,203,155 people shows a slight negative correlation between the proportion of Immigrants from Korea and median male earnings in the United States with a correlation coefficient (R) of -0.070 and weighted average of $65,079, a difference of 6.3%.
Median Male Earnings Correlation Summary
| Measurement | Greek | Immigrants from Korea |
| Minimum | $12,679 | $30,795 |
| Maximum | $175,000 | $153,870 |
| Range | $162,321 | $123,075 |
| Mean | $66,512 | $73,429 |
| Median | $65,740 | $71,921 |
| Interquartile 25% (IQ1) | $49,612 | $56,978 |
| Interquartile 75% (IQ3) | $75,987 | $82,188 |
| Interquartile Range (IQR) | $26,375 | $25,211 |
| Standard Deviation (Sample) | $26,480 | $25,444 |
| Standard Deviation (Population) | $26,203 | $25,220 |
Similar Demographics by Median Male Earnings
Demographics Similar to Greeks by Median Male Earnings
In terms of median male earnings, the demographic groups most similar to Greeks are Lithuanian ($61,228, a difference of 0.020%), Immigrants from Scotland ($61,220, a difference of 0.040%), New Zealander ($61,199, a difference of 0.070%), Immigrants from Netherlands ($61,096, a difference of 0.24%), and Egyptian ($61,095, a difference of 0.24%).
| Demographics | Rating | Rank | Median Male Earnings |
| Immigrants | Malaysia | 99.9 /100 | #48 | Exceptional $62,121 |
| Immigrants | Europe | 99.9 /100 | #49 | Exceptional $62,057 |
| Bhutanese | 99.9 /100 | #50 | Exceptional $61,759 |
| Estonians | 99.9 /100 | #51 | Exceptional $61,710 |
| Immigrants | Norway | 99.9 /100 | #52 | Exceptional $61,628 |
| South Africans | 99.9 /100 | #53 | Exceptional $61,460 |
| Immigrants | Latvia | 99.9 /100 | #54 | Exceptional $61,422 |
| Greeks | 99.9 /100 | #55 | Exceptional $61,242 |
| Lithuanians | 99.9 /100 | #56 | Exceptional $61,228 |
| Immigrants | Scotland | 99.9 /100 | #57 | Exceptional $61,220 |
| New Zealanders | 99.9 /100 | #58 | Exceptional $61,199 |
| Immigrants | Netherlands | 99.8 /100 | #59 | Exceptional $61,096 |
| Egyptians | 99.8 /100 | #60 | Exceptional $61,095 |
| Bolivians | 99.8 /100 | #61 | Exceptional $61,066 |
| Immigrants | Romania | 99.8 /100 | #62 | Exceptional $61,040 |
Demographics Similar to Immigrants from Korea by Median Male Earnings
In terms of median male earnings, the demographic groups most similar to Immigrants from Korea are Immigrants from Northern Europe ($64,987, a difference of 0.14%), Burmese ($65,236, a difference of 0.24%), Immigrants from Sweden ($65,406, a difference of 0.50%), Immigrants from Japan ($65,518, a difference of 0.67%), and Immigrants from Denmark ($64,625, a difference of 0.70%).
| Demographics | Rating | Rank | Median Male Earnings |
| Eastern Europeans | 100.0 /100 | #16 | Exceptional $66,472 |
| Immigrants | Belgium | 100.0 /100 | #17 | Exceptional $66,125 |
| Indians (Asian) | 100.0 /100 | #18 | Exceptional $66,078 |
| Cypriots | 100.0 /100 | #19 | Exceptional $65,549 |
| Immigrants | Japan | 100.0 /100 | #20 | Exceptional $65,518 |
| Immigrants | Sweden | 100.0 /100 | #21 | Exceptional $65,406 |
| Burmese | 100.0 /100 | #22 | Exceptional $65,236 |
| Immigrants | Korea | 100.0 /100 | #23 | Exceptional $65,079 |
| Immigrants | Northern Europe | 100.0 /100 | #24 | Exceptional $64,987 |
| Immigrants | Denmark | 100.0 /100 | #25 | Exceptional $64,625 |
| Turks | 100.0 /100 | #26 | Exceptional $64,253 |
| Immigrants | Switzerland | 100.0 /100 | #27 | Exceptional $63,944 |
| Russians | 100.0 /100 | #28 | Exceptional $63,939 |
| Asians | 100.0 /100 | #29 | Exceptional $63,827 |
| Immigrants | France | 100.0 /100 | #30 | Exceptional $63,715 |