French Canadian vs Armenian Wage/Income Gap
COMPARE
French Canadian
Armenian
Wage/Income Gap
Wage/Income Gap Comparison
French Canadians
Armenians
28.1%
WAGE/INCOME GAP
0.4/ 100
METRIC RATING
283rd/ 347
METRIC RANK
24.8%
WAGE/INCOME GAP
91.3/ 100
METRIC RATING
136th/ 347
METRIC RANK
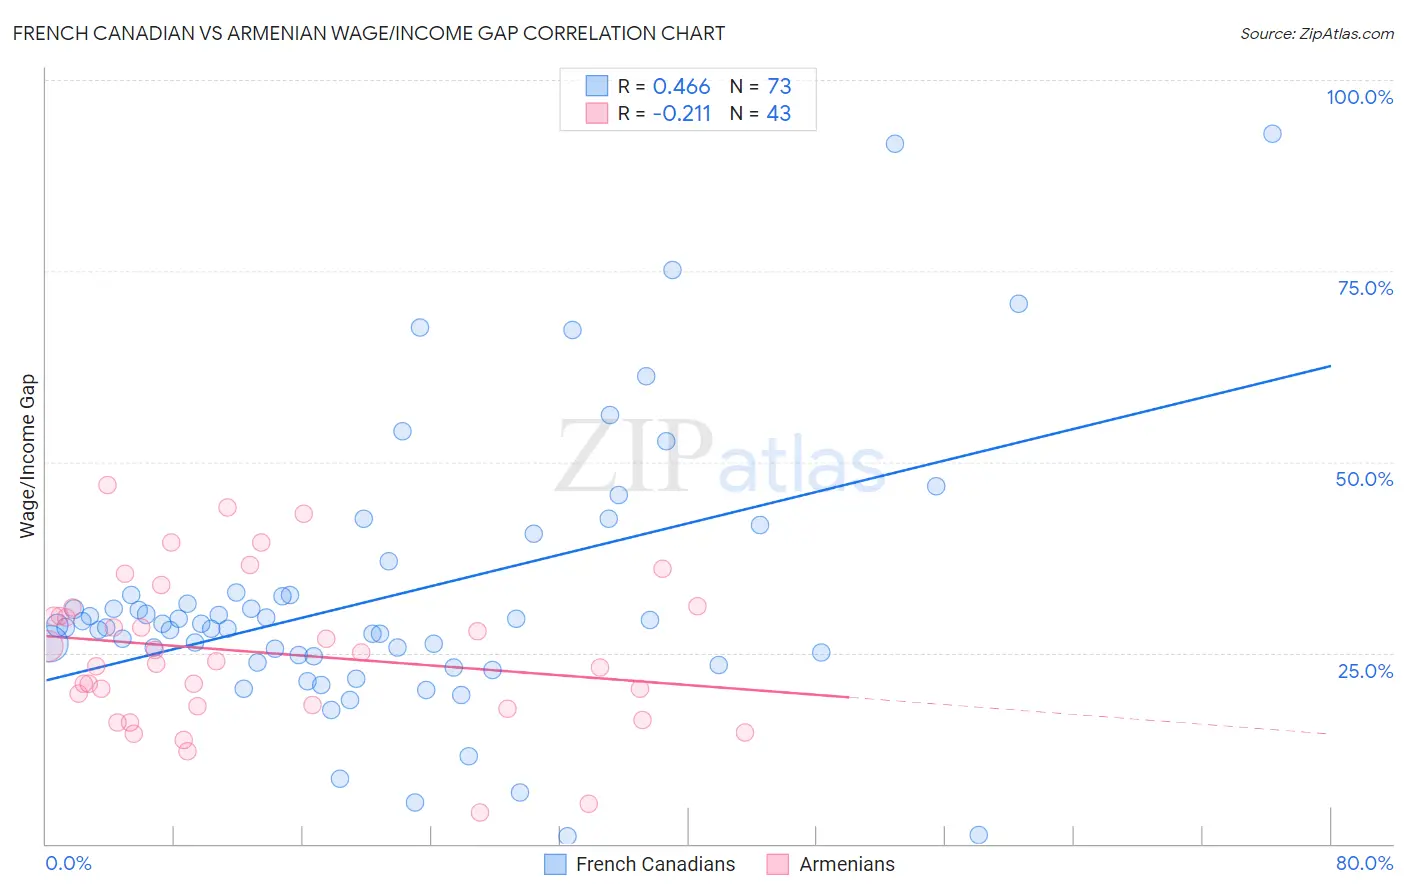
French Canadian vs Armenian Wage/Income Gap Correlation Chart
The statistical analysis conducted on geographies consisting of 501,595,404 people shows a moderate positive correlation between the proportion of French Canadians and wage/income gap percentage in the United States with a correlation coefficient (R) of 0.466 and weighted average of 28.1%. Similarly, the statistical analysis conducted on geographies consisting of 310,772,070 people shows a weak negative correlation between the proportion of Armenians and wage/income gap percentage in the United States with a correlation coefficient (R) of -0.211 and weighted average of 24.8%, a difference of 13.3%.
Wage/Income Gap Correlation Summary
| Measurement | French Canadian | Armenian |
| Minimum | 0.99% | 4.0% |
| Maximum | 92.9% | 46.9% |
| Range | 91.9% | 42.9% |
| Mean | 32.4% | 25.0% |
| Median | 28.6% | 23.9% |
| Interquartile 25% (IQ1) | 24.1% | 18.0% |
| Interquartile 75% (IQ3) | 32.8% | 30.9% |
| Interquartile Range (IQR) | 8.6% | 12.9% |
| Standard Deviation (Sample) | 17.7% | 9.9% |
| Standard Deviation (Population) | 17.6% | 9.7% |
Similar Demographics by Wage/Income Gap
Demographics Similar to French Canadians by Wage/Income Gap
In terms of wage/income gap, the demographic groups most similar to French Canadians are Immigrants from Sweden (28.1%, a difference of 0.010%), Italian (28.1%, a difference of 0.14%), Immigrants from Austria (28.1%, a difference of 0.17%), South African (28.0%, a difference of 0.18%), and Okinawan (28.1%, a difference of 0.20%).
| Demographics | Rating | Rank | Wage/Income Gap |
| Lebanese | 0.7 /100 | #276 | Tragic 27.9% |
| Latvians | 0.7 /100 | #277 | Tragic 27.9% |
| Immigrants | England | 0.6 /100 | #278 | Tragic 27.9% |
| Romanians | 0.5 /100 | #279 | Tragic 28.0% |
| Russians | 0.5 /100 | #280 | Tragic 28.0% |
| Burmese | 0.5 /100 | #281 | Tragic 28.0% |
| South Africans | 0.5 /100 | #282 | Tragic 28.0% |
| French Canadians | 0.4 /100 | #283 | Tragic 28.1% |
| Immigrants | Sweden | 0.4 /100 | #284 | Tragic 28.1% |
| Italians | 0.4 /100 | #285 | Tragic 28.1% |
| Immigrants | Austria | 0.4 /100 | #286 | Tragic 28.1% |
| Okinawans | 0.4 /100 | #287 | Tragic 28.1% |
| Choctaw | 0.4 /100 | #288 | Tragic 28.1% |
| Canadians | 0.3 /100 | #289 | Tragic 28.1% |
| Australians | 0.3 /100 | #290 | Tragic 28.2% |
Demographics Similar to Armenians by Wage/Income Gap
In terms of wage/income gap, the demographic groups most similar to Armenians are Immigrants from South Eastern Asia (24.8%, a difference of 0.080%), South American Indian (24.7%, a difference of 0.14%), Mexican American Indian (24.7%, a difference of 0.20%), Immigrants from Costa Rica (24.7%, a difference of 0.24%), and Colombian (24.7%, a difference of 0.24%).
| Demographics | Rating | Rank | Wage/Income Gap |
| Yup'ik | 93.3 /100 | #129 | Exceptional 24.7% |
| Alsatians | 93.2 /100 | #130 | Exceptional 24.7% |
| Immigrants | Philippines | 93.0 /100 | #131 | Exceptional 24.7% |
| Immigrants | Costa Rica | 92.4 /100 | #132 | Exceptional 24.7% |
| Colombians | 92.4 /100 | #133 | Exceptional 24.7% |
| Mexican American Indians | 92.2 /100 | #134 | Exceptional 24.7% |
| South American Indians | 92.0 /100 | #135 | Exceptional 24.7% |
| Armenians | 91.3 /100 | #136 | Exceptional 24.8% |
| Immigrants | South Eastern Asia | 90.9 /100 | #137 | Exceptional 24.8% |
| Immigrants | Bosnia and Herzegovina | 90.1 /100 | #138 | Exceptional 24.8% |
| Hispanics or Latinos | 89.5 /100 | #139 | Excellent 24.9% |
| Immigrants | Nepal | 89.3 /100 | #140 | Excellent 24.9% |
| Hawaiians | 89.3 /100 | #141 | Excellent 24.9% |
| Afghans | 88.1 /100 | #142 | Excellent 24.9% |
| Immigrants | Uganda | 88.0 /100 | #143 | Excellent 24.9% |