French Canadian vs Armenian Unemployment Among Women with Children Ages 6 to 17 years
COMPARE
French Canadian
Armenian
Unemployment Among Women with Children Ages 6 to 17 years
Unemployment Among Women with Children Ages 6 to 17 years Comparison
French Canadians
Armenians
10.3%
UNEMPLOYMENT AMONG WOMEN WITH CHILDREN AGES 6 TO 17 YEARS
0.0/ 100
METRIC RATING
309th/ 347
METRIC RANK
8.3%
UNEMPLOYMENT AMONG WOMEN WITH CHILDREN AGES 6 TO 17 YEARS
99.9/ 100
METRIC RATING
67th/ 347
METRIC RANK
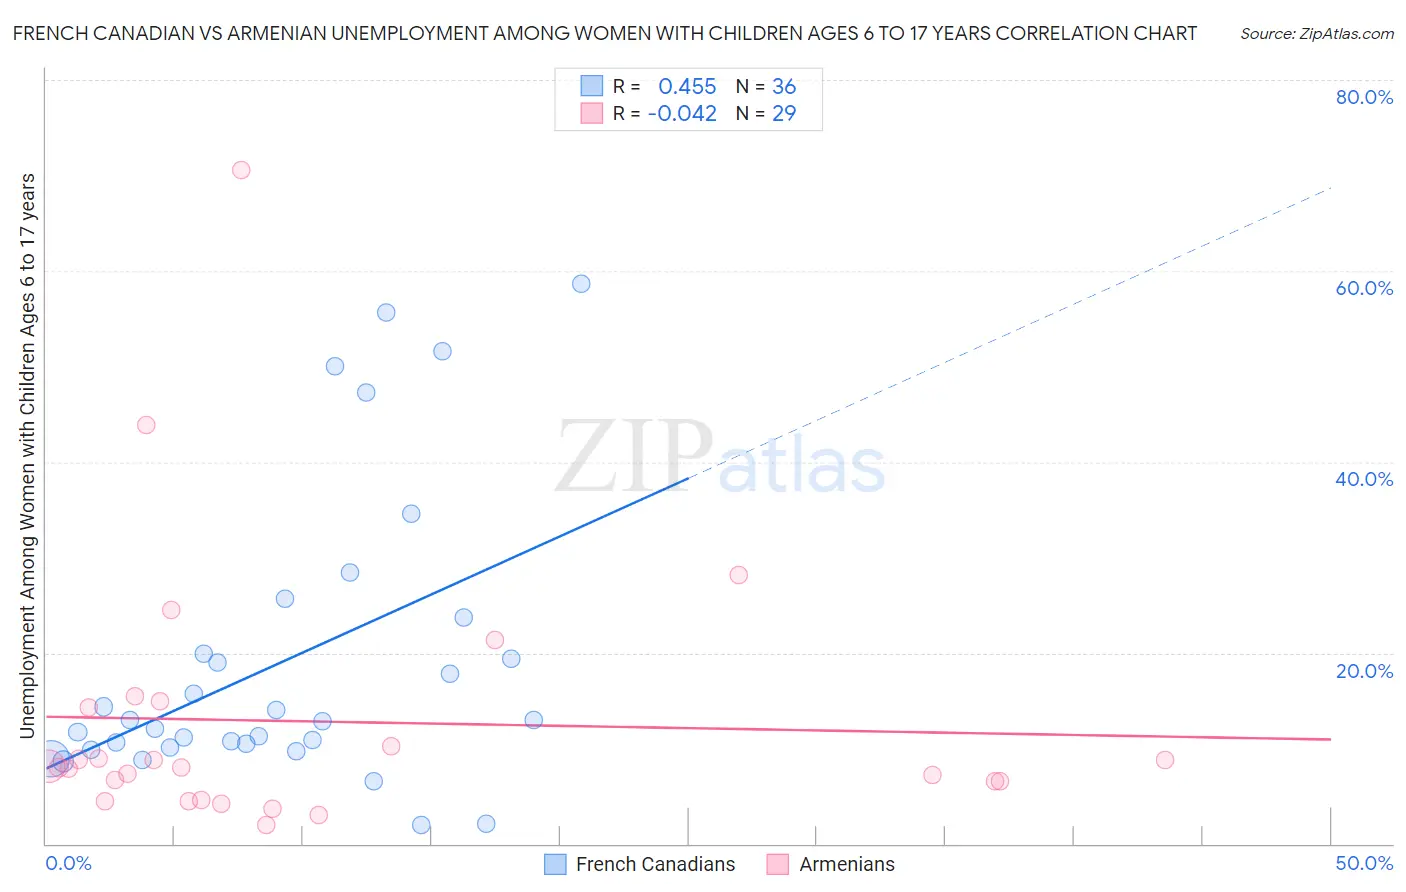
French Canadian vs Armenian Unemployment Among Women with Children Ages 6 to 17 years Correlation Chart
The statistical analysis conducted on geographies consisting of 329,058,978 people shows a moderate positive correlation between the proportion of French Canadians and unemployment rate among women with children between the ages 6 and 17 in the United States with a correlation coefficient (R) of 0.455 and weighted average of 10.3%. Similarly, the statistical analysis conducted on geographies consisting of 229,483,477 people shows no correlation between the proportion of Armenians and unemployment rate among women with children between the ages 6 and 17 in the United States with a correlation coefficient (R) of -0.042 and weighted average of 8.3%, a difference of 24.2%.
Unemployment Among Women with Children Ages 6 to 17 years Correlation Summary
| Measurement | French Canadian | Armenian |
| Minimum | 2.0% | 1.9% |
| Maximum | 58.6% | 70.6% |
| Range | 56.6% | 68.7% |
| Mean | 19.2% | 12.8% |
| Median | 12.9% | 8.0% |
| Interquartile 25% (IQ1) | 10.2% | 5.6% |
| Interquartile 75% (IQ3) | 21.8% | 14.6% |
| Interquartile Range (IQR) | 11.6% | 9.0% |
| Standard Deviation (Sample) | 15.2% | 14.2% |
| Standard Deviation (Population) | 15.0% | 14.0% |
Similar Demographics by Unemployment Among Women with Children Ages 6 to 17 years
Demographics Similar to French Canadians by Unemployment Among Women with Children Ages 6 to 17 years
In terms of unemployment among women with children ages 6 to 17 years, the demographic groups most similar to French Canadians are Alaska Native (10.3%, a difference of 0.050%), Immigrants from Liberia (10.3%, a difference of 0.080%), Dutch West Indian (10.2%, a difference of 0.54%), Immigrants from Senegal (10.2%, a difference of 0.55%), and Paraguayan (10.2%, a difference of 0.78%).
| Demographics | Rating | Rank | Unemployment Among Women with Children Ages 6 to 17 years |
| Venezuelans | 0.0 /100 | #302 | Tragic 10.2% |
| Immigrants | Ecuador | 0.0 /100 | #303 | Tragic 10.2% |
| Immigrants | Venezuela | 0.0 /100 | #304 | Tragic 10.2% |
| Immigrants | Nigeria | 0.0 /100 | #305 | Tragic 10.2% |
| Paraguayans | 0.0 /100 | #306 | Tragic 10.2% |
| Immigrants | Senegal | 0.0 /100 | #307 | Tragic 10.2% |
| Dutch West Indians | 0.0 /100 | #308 | Tragic 10.2% |
| French Canadians | 0.0 /100 | #309 | Tragic 10.3% |
| Alaska Natives | 0.0 /100 | #310 | Tragic 10.3% |
| Immigrants | Liberia | 0.0 /100 | #311 | Tragic 10.3% |
| Africans | 0.0 /100 | #312 | Tragic 10.4% |
| Americans | 0.0 /100 | #313 | Tragic 10.4% |
| Immigrants | Cabo Verde | 0.0 /100 | #314 | Tragic 10.4% |
| Bahamians | 0.0 /100 | #315 | Tragic 10.4% |
| Immigrants | Dominica | 0.0 /100 | #316 | Tragic 10.5% |
Demographics Similar to Armenians by Unemployment Among Women with Children Ages 6 to 17 years
In terms of unemployment among women with children ages 6 to 17 years, the demographic groups most similar to Armenians are Marshallese (8.3%, a difference of 0.080%), Luxembourger (8.3%, a difference of 0.10%), Immigrants from Thailand (8.3%, a difference of 0.11%), Norwegian (8.3%, a difference of 0.19%), and Immigrants from Albania (8.3%, a difference of 0.23%).
| Demographics | Rating | Rank | Unemployment Among Women with Children Ages 6 to 17 years |
| Basques | 100.0 /100 | #60 | Exceptional 8.2% |
| Koreans | 100.0 /100 | #61 | Exceptional 8.2% |
| Spanish American Indians | 100.0 /100 | #62 | Exceptional 8.2% |
| Immigrants | South Eastern Asia | 99.9 /100 | #63 | Exceptional 8.2% |
| Immigrants | Kuwait | 99.9 /100 | #64 | Exceptional 8.3% |
| Immigrants | Albania | 99.9 /100 | #65 | Exceptional 8.3% |
| Luxembourgers | 99.9 /100 | #66 | Exceptional 8.3% |
| Armenians | 99.9 /100 | #67 | Exceptional 8.3% |
| Marshallese | 99.9 /100 | #68 | Exceptional 8.3% |
| Immigrants | Thailand | 99.9 /100 | #69 | Exceptional 8.3% |
| Norwegians | 99.9 /100 | #70 | Exceptional 8.3% |
| Immigrants | Australia | 99.8 /100 | #71 | Exceptional 8.3% |
| Immigrants | Nepal | 99.8 /100 | #72 | Exceptional 8.3% |
| Spanish Americans | 99.8 /100 | #73 | Exceptional 8.4% |
| Samoans | 99.7 /100 | #74 | Exceptional 8.4% |