French American Indian vs Palestinian Wage/Income Gap
COMPARE
French American Indian
Palestinian
Wage/Income Gap
Wage/Income Gap Comparison
French American Indians
Palestinians
25.4%
WAGE/INCOME GAP
72.5/ 100
METRIC RATING
160th/ 347
METRIC RANK
26.1%
WAGE/INCOME GAP
29.9/ 100
METRIC RATING
187th/ 347
METRIC RANK
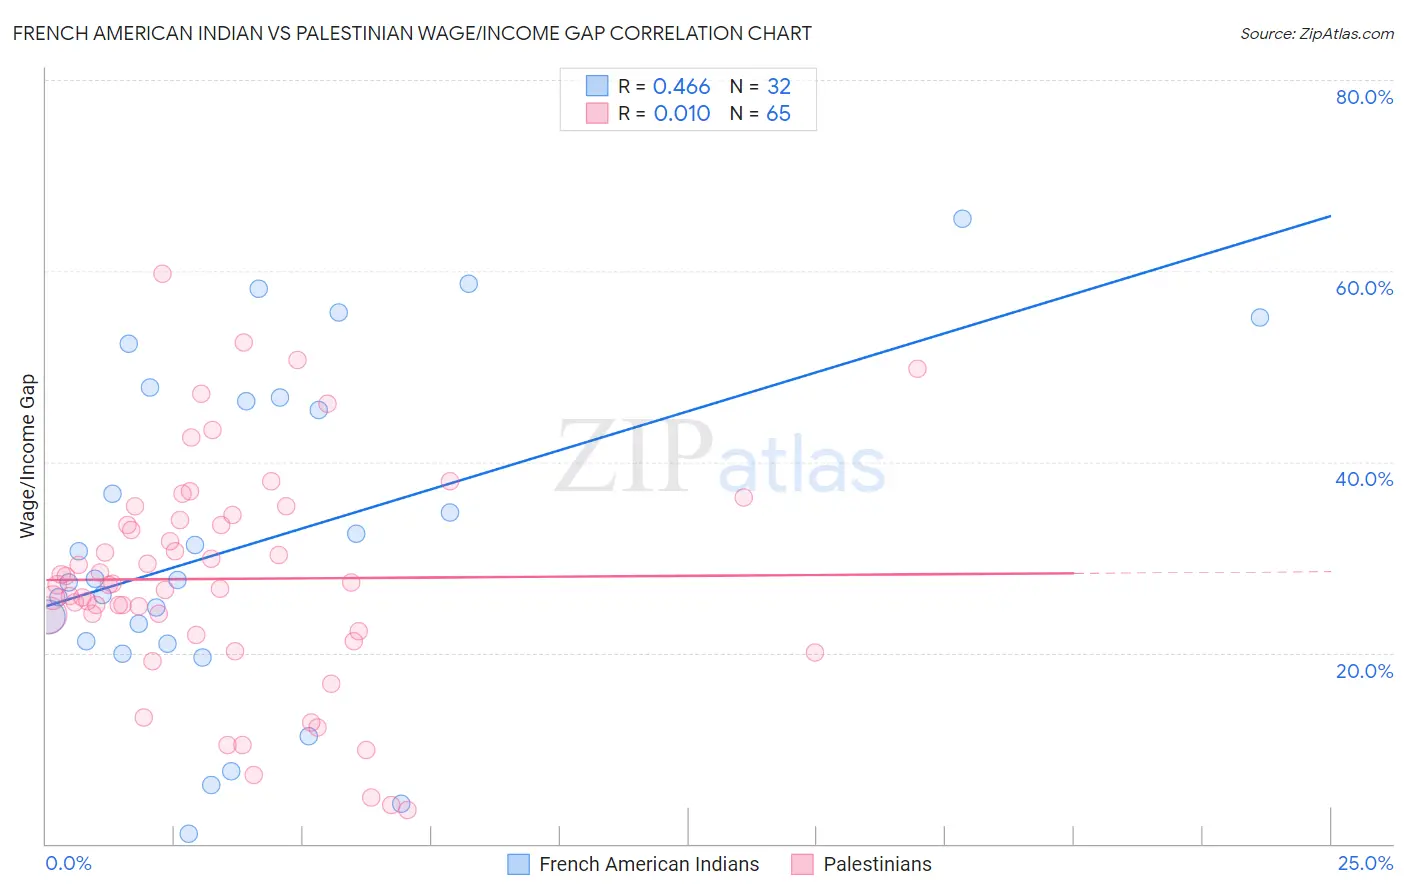
French American Indian vs Palestinian Wage/Income Gap Correlation Chart
The statistical analysis conducted on geographies consisting of 131,928,964 people shows a moderate positive correlation between the proportion of French American Indians and wage/income gap percentage in the United States with a correlation coefficient (R) of 0.466 and weighted average of 25.4%. Similarly, the statistical analysis conducted on geographies consisting of 216,443,706 people shows no correlation between the proportion of Palestinians and wage/income gap percentage in the United States with a correlation coefficient (R) of 0.010 and weighted average of 26.1%, a difference of 3.0%.
Wage/Income Gap Correlation Summary
| Measurement | French American Indian | Palestinian |
| Minimum | 1.1% | 3.6% |
| Maximum | 65.5% | 59.7% |
| Range | 64.4% | 56.1% |
| Mean | 31.7% | 27.8% |
| Median | 27.7% | 27.1% |
| Interquartile 25% (IQ1) | 21.1% | 22.0% |
| Interquartile 75% (IQ3) | 46.5% | 34.1% |
| Interquartile Range (IQR) | 25.5% | 12.1% |
| Standard Deviation (Sample) | 17.2% | 11.7% |
| Standard Deviation (Population) | 17.0% | 11.6% |
Similar Demographics by Wage/Income Gap
Demographics Similar to French American Indians by Wage/Income Gap
In terms of wage/income gap, the demographic groups most similar to French American Indians are Puget Sound Salish (25.3%, a difference of 0.040%), Immigrants from Zimbabwe (25.3%, a difference of 0.10%), Albanian (25.4%, a difference of 0.26%), Costa Rican (25.3%, a difference of 0.28%), and Shoshone (25.4%, a difference of 0.28%).
| Demographics | Rating | Rank | Wage/Income Gap |
| Blackfeet | 78.1 /100 | #153 | Good 25.2% |
| Immigrants | Northern Africa | 78.1 /100 | #154 | Good 25.2% |
| Immigrants | Vietnam | 77.7 /100 | #155 | Good 25.2% |
| Immigrants | Mexico | 76.4 /100 | #156 | Good 25.3% |
| Costa Ricans | 75.8 /100 | #157 | Good 25.3% |
| Immigrants | Zimbabwe | 73.7 /100 | #158 | Good 25.3% |
| Puget Sound Salish | 73.0 /100 | #159 | Good 25.3% |
| French American Indians | 72.5 /100 | #160 | Good 25.4% |
| Albanians | 69.4 /100 | #161 | Good 25.4% |
| Shoshone | 69.0 /100 | #162 | Good 25.4% |
| Native Hawaiians | 69.0 /100 | #163 | Good 25.4% |
| Koreans | 68.6 /100 | #164 | Good 25.4% |
| Immigrants | Hong Kong | 64.0 /100 | #165 | Good 25.5% |
| Immigrants | Ukraine | 63.8 /100 | #166 | Good 25.5% |
| Paiute | 62.9 /100 | #167 | Good 25.5% |
Demographics Similar to Palestinians by Wage/Income Gap
In terms of wage/income gap, the demographic groups most similar to Palestinians are Immigrants from Egypt (26.1%, a difference of 0.010%), Immigrants from Indonesia (26.1%, a difference of 0.19%), Immigrants from Moldova (26.2%, a difference of 0.26%), Pakistani (26.1%, a difference of 0.28%), and Mexican (26.0%, a difference of 0.33%).
| Demographics | Rating | Rank | Wage/Income Gap |
| Guamanians/Chamorros | 38.0 /100 | #180 | Fair 26.0% |
| Immigrants | Bolivia | 36.4 /100 | #181 | Fair 26.0% |
| Immigrants | Serbia | 35.4 /100 | #182 | Fair 26.0% |
| Immigrants | Kazakhstan | 35.2 /100 | #183 | Fair 26.0% |
| Mexicans | 34.4 /100 | #184 | Fair 26.0% |
| Pakistanis | 33.7 /100 | #185 | Fair 26.1% |
| Immigrants | Indonesia | 32.5 /100 | #186 | Fair 26.1% |
| Palestinians | 29.9 /100 | #187 | Fair 26.1% |
| Immigrants | Egypt | 29.9 /100 | #188 | Fair 26.1% |
| Immigrants | Moldova | 26.6 /100 | #189 | Fair 26.2% |
| Immigrants | Croatia | 24.8 /100 | #190 | Fair 26.2% |
| Immigrants | Venezuela | 24.7 /100 | #191 | Fair 26.2% |
| Immigrants | Bulgaria | 22.5 /100 | #192 | Fair 26.3% |
| Immigrants | Jordan | 22.4 /100 | #193 | Fair 26.3% |
| Chileans | 22.3 /100 | #194 | Fair 26.3% |