Yup'ik vs Apache Median Male Earnings
COMPARE
Yup'ik
Apache
Median Male Earnings
Median Male Earnings Comparison
Yup'ik
Apache
$39,504
MEDIAN MALE EARNINGS
0.0/ 100
METRIC RATING
347th/ 347
METRIC RANK
$46,429
MEDIAN MALE EARNINGS
0.0/ 100
METRIC RATING
311th/ 347
METRIC RANK
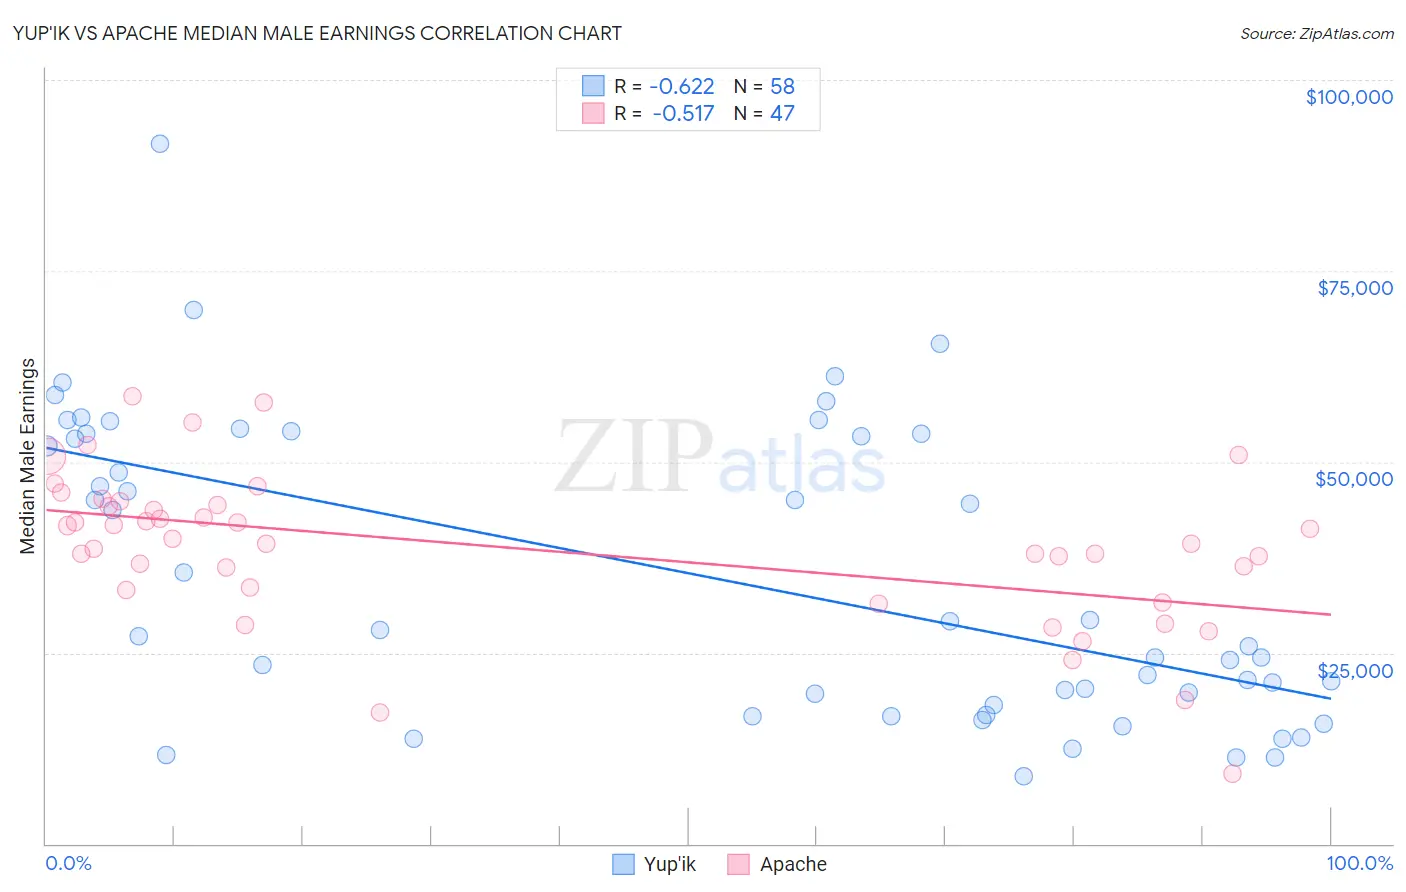
Yup'ik vs Apache Median Male Earnings Correlation Chart
The statistical analysis conducted on geographies consisting of 39,949,304 people shows a significant negative correlation between the proportion of Yup'ik and median male earnings in the United States with a correlation coefficient (R) of -0.622 and weighted average of $39,504. Similarly, the statistical analysis conducted on geographies consisting of 231,058,501 people shows a substantial negative correlation between the proportion of Apache and median male earnings in the United States with a correlation coefficient (R) of -0.517 and weighted average of $46,429, a difference of 17.5%.
Median Male Earnings Correlation Summary
| Measurement | Yup'ik | Apache |
| Minimum | $8,859 | $9,161 |
| Maximum | $91,667 | $58,566 |
| Range | $82,808 | $49,405 |
| Mean | $35,016 | $38,686 |
| Median | $27,549 | $39,318 |
| Interquartile 25% (IQ1) | $18,125 | $33,190 |
| Interquartile 75% (IQ3) | $53,694 | $44,375 |
| Interquartile Range (IQR) | $35,569 | $11,185 |
| Standard Deviation (Sample) | $19,492 | $10,062 |
| Standard Deviation (Population) | $19,323 | $9,955 |
Similar Demographics by Median Male Earnings
Demographics Similar to Yup'ik by Median Male Earnings
In terms of median male earnings, the demographic groups most similar to Yup'ik are Tohono O'odham ($39,543, a difference of 0.10%), Puerto Rican ($40,071, a difference of 1.4%), Pueblo ($41,314, a difference of 4.6%), Lumbee ($41,715, a difference of 5.6%), and Arapaho ($41,758, a difference of 5.7%).
| Demographics | Rating | Rank | Median Male Earnings |
| Immigrants | Congo | 0.0 /100 | #333 | Tragic $44,204 |
| Immigrants | Yemen | 0.0 /100 | #334 | Tragic $44,083 |
| Spanish American Indians | 0.0 /100 | #335 | Tragic $44,010 |
| Immigrants | Cuba | 0.0 /100 | #336 | Tragic $43,461 |
| Menominee | 0.0 /100 | #337 | Tragic $42,581 |
| Crow | 0.0 /100 | #338 | Tragic $42,434 |
| Pima | 0.0 /100 | #339 | Tragic $42,357 |
| Navajo | 0.0 /100 | #340 | Tragic $42,098 |
| Hopi | 0.0 /100 | #341 | Tragic $42,060 |
| Arapaho | 0.0 /100 | #342 | Tragic $41,758 |
| Lumbee | 0.0 /100 | #343 | Tragic $41,715 |
| Pueblo | 0.0 /100 | #344 | Tragic $41,314 |
| Puerto Ricans | 0.0 /100 | #345 | Tragic $40,071 |
| Tohono O'odham | 0.0 /100 | #346 | Tragic $39,543 |
| Yup'ik | 0.0 /100 | #347 | Tragic $39,504 |
Demographics Similar to Apache by Median Male Earnings
In terms of median male earnings, the demographic groups most similar to Apache are Hispanic or Latino ($46,419, a difference of 0.020%), Honduran ($46,374, a difference of 0.12%), Chippewa ($46,368, a difference of 0.13%), Cuban ($46,580, a difference of 0.33%), and Creek ($46,594, a difference of 0.36%).
| Demographics | Rating | Rank | Median Male Earnings |
| Bangladeshis | 0.1 /100 | #304 | Tragic $46,744 |
| Guatemalans | 0.0 /100 | #305 | Tragic $46,736 |
| Dutch West Indians | 0.0 /100 | #306 | Tragic $46,656 |
| Immigrants | Dominican Republic | 0.0 /100 | #307 | Tragic $46,655 |
| Ottawa | 0.0 /100 | #308 | Tragic $46,611 |
| Creek | 0.0 /100 | #309 | Tragic $46,594 |
| Cubans | 0.0 /100 | #310 | Tragic $46,580 |
| Apache | 0.0 /100 | #311 | Tragic $46,429 |
| Hispanics or Latinos | 0.0 /100 | #312 | Tragic $46,419 |
| Hondurans | 0.0 /100 | #313 | Tragic $46,374 |
| Chippewa | 0.0 /100 | #314 | Tragic $46,368 |
| Immigrants | Guatemala | 0.0 /100 | #315 | Tragic $46,244 |
| Immigrants | Caribbean | 0.0 /100 | #316 | Tragic $46,193 |
| Mexicans | 0.0 /100 | #317 | Tragic $46,147 |
| Cheyenne | 0.0 /100 | #318 | Tragic $46,062 |