Turkish vs Apache Median Male Earnings
COMPARE
Turkish
Apache
Median Male Earnings
Median Male Earnings Comparison
Turks
Apache
$64,253
MEDIAN MALE EARNINGS
100.0/ 100
METRIC RATING
26th/ 347
METRIC RANK
$46,429
MEDIAN MALE EARNINGS
0.0/ 100
METRIC RATING
311th/ 347
METRIC RANK
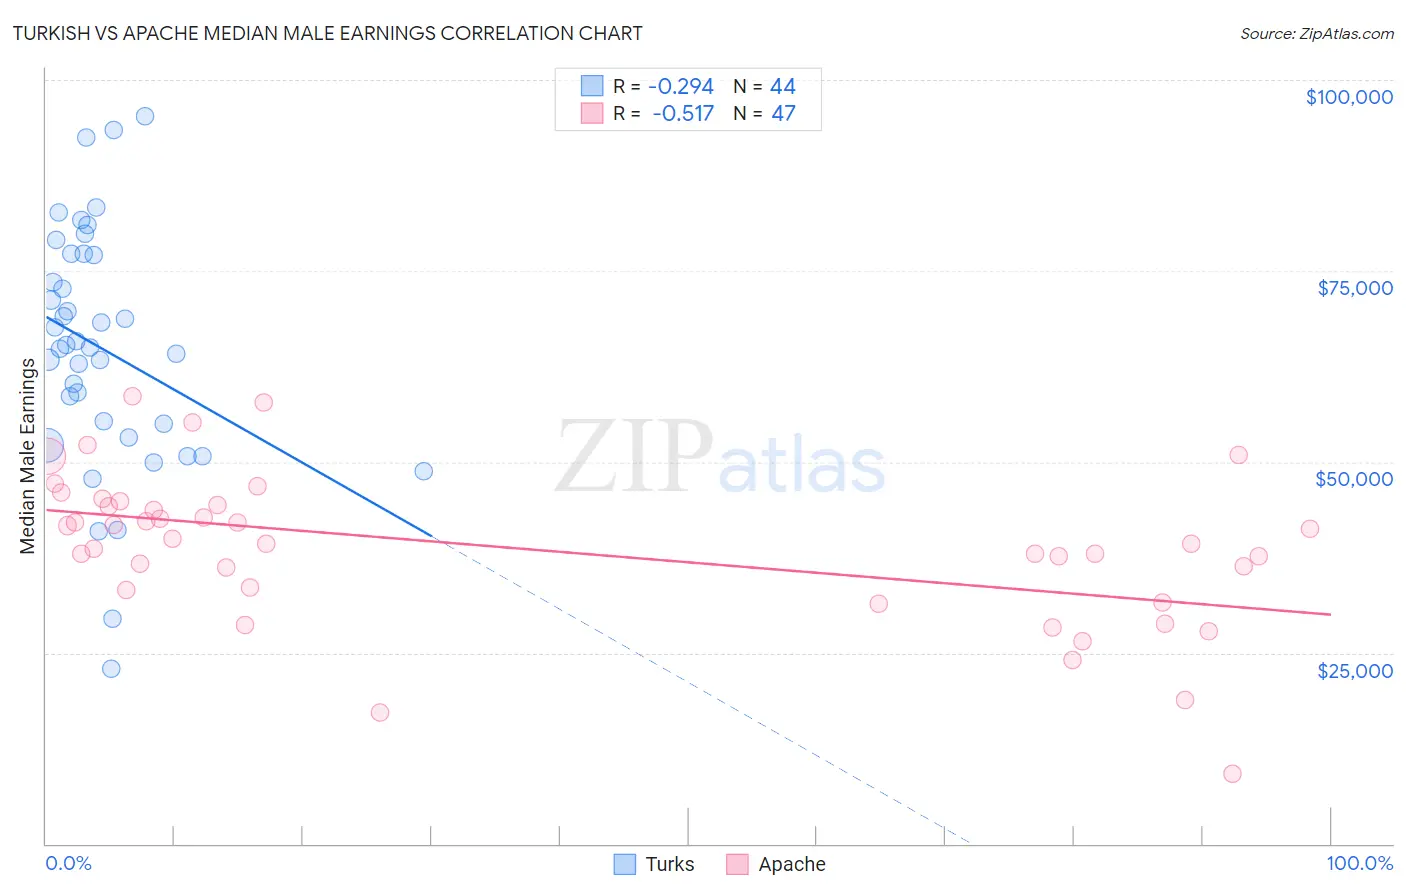
Turkish vs Apache Median Male Earnings Correlation Chart
The statistical analysis conducted on geographies consisting of 271,821,901 people shows a weak negative correlation between the proportion of Turks and median male earnings in the United States with a correlation coefficient (R) of -0.294 and weighted average of $64,253. Similarly, the statistical analysis conducted on geographies consisting of 231,058,501 people shows a substantial negative correlation between the proportion of Apache and median male earnings in the United States with a correlation coefficient (R) of -0.517 and weighted average of $46,429, a difference of 38.4%.
Median Male Earnings Correlation Summary
| Measurement | Turkish | Apache |
| Minimum | $22,917 | $9,161 |
| Maximum | $95,313 | $58,566 |
| Range | $72,396 | $49,405 |
| Mean | $64,813 | $38,686 |
| Median | $65,160 | $39,318 |
| Interquartile 25% (IQ1) | $54,093 | $33,190 |
| Interquartile 75% (IQ3) | $77,144 | $44,375 |
| Interquartile Range (IQR) | $23,051 | $11,185 |
| Standard Deviation (Sample) | $15,821 | $10,062 |
| Standard Deviation (Population) | $15,640 | $9,955 |
Similar Demographics by Median Male Earnings
Demographics Similar to Turks by Median Male Earnings
In terms of median male earnings, the demographic groups most similar to Turks are Immigrants from Switzerland ($63,944, a difference of 0.48%), Russian ($63,939, a difference of 0.49%), Immigrants from Denmark ($64,625, a difference of 0.58%), Asian ($63,827, a difference of 0.67%), and Immigrants from France ($63,715, a difference of 0.84%).
| Demographics | Rating | Rank | Median Male Earnings |
| Cypriots | 100.0 /100 | #19 | Exceptional $65,549 |
| Immigrants | Japan | 100.0 /100 | #20 | Exceptional $65,518 |
| Immigrants | Sweden | 100.0 /100 | #21 | Exceptional $65,406 |
| Burmese | 100.0 /100 | #22 | Exceptional $65,236 |
| Immigrants | Korea | 100.0 /100 | #23 | Exceptional $65,079 |
| Immigrants | Northern Europe | 100.0 /100 | #24 | Exceptional $64,987 |
| Immigrants | Denmark | 100.0 /100 | #25 | Exceptional $64,625 |
| Turks | 100.0 /100 | #26 | Exceptional $64,253 |
| Immigrants | Switzerland | 100.0 /100 | #27 | Exceptional $63,944 |
| Russians | 100.0 /100 | #28 | Exceptional $63,939 |
| Asians | 100.0 /100 | #29 | Exceptional $63,827 |
| Immigrants | France | 100.0 /100 | #30 | Exceptional $63,715 |
| Latvians | 100.0 /100 | #31 | Exceptional $63,498 |
| Soviet Union | 100.0 /100 | #32 | Exceptional $63,382 |
| Immigrants | Lithuania | 100.0 /100 | #33 | Exceptional $63,346 |
Demographics Similar to Apache by Median Male Earnings
In terms of median male earnings, the demographic groups most similar to Apache are Hispanic or Latino ($46,419, a difference of 0.020%), Honduran ($46,374, a difference of 0.12%), Chippewa ($46,368, a difference of 0.13%), Cuban ($46,580, a difference of 0.33%), and Creek ($46,594, a difference of 0.36%).
| Demographics | Rating | Rank | Median Male Earnings |
| Bangladeshis | 0.1 /100 | #304 | Tragic $46,744 |
| Guatemalans | 0.0 /100 | #305 | Tragic $46,736 |
| Dutch West Indians | 0.0 /100 | #306 | Tragic $46,656 |
| Immigrants | Dominican Republic | 0.0 /100 | #307 | Tragic $46,655 |
| Ottawa | 0.0 /100 | #308 | Tragic $46,611 |
| Creek | 0.0 /100 | #309 | Tragic $46,594 |
| Cubans | 0.0 /100 | #310 | Tragic $46,580 |
| Apache | 0.0 /100 | #311 | Tragic $46,429 |
| Hispanics or Latinos | 0.0 /100 | #312 | Tragic $46,419 |
| Hondurans | 0.0 /100 | #313 | Tragic $46,374 |
| Chippewa | 0.0 /100 | #314 | Tragic $46,368 |
| Immigrants | Guatemala | 0.0 /100 | #315 | Tragic $46,244 |
| Immigrants | Caribbean | 0.0 /100 | #316 | Tragic $46,193 |
| Mexicans | 0.0 /100 | #317 | Tragic $46,147 |
| Cheyenne | 0.0 /100 | #318 | Tragic $46,062 |