Finnish vs Apache College, Under 1 year
COMPARE
Finnish
Apache
College, Under 1 year
College, Under 1 year Comparison
Finns
Apache
66.9%
COLLEGE, UNDER 1 YEAR
88.6/ 100
METRIC RATING
131st/ 347
METRIC RANK
58.0%
COLLEGE, UNDER 1 YEAR
0.0/ 100
METRIC RATING
302nd/ 347
METRIC RANK
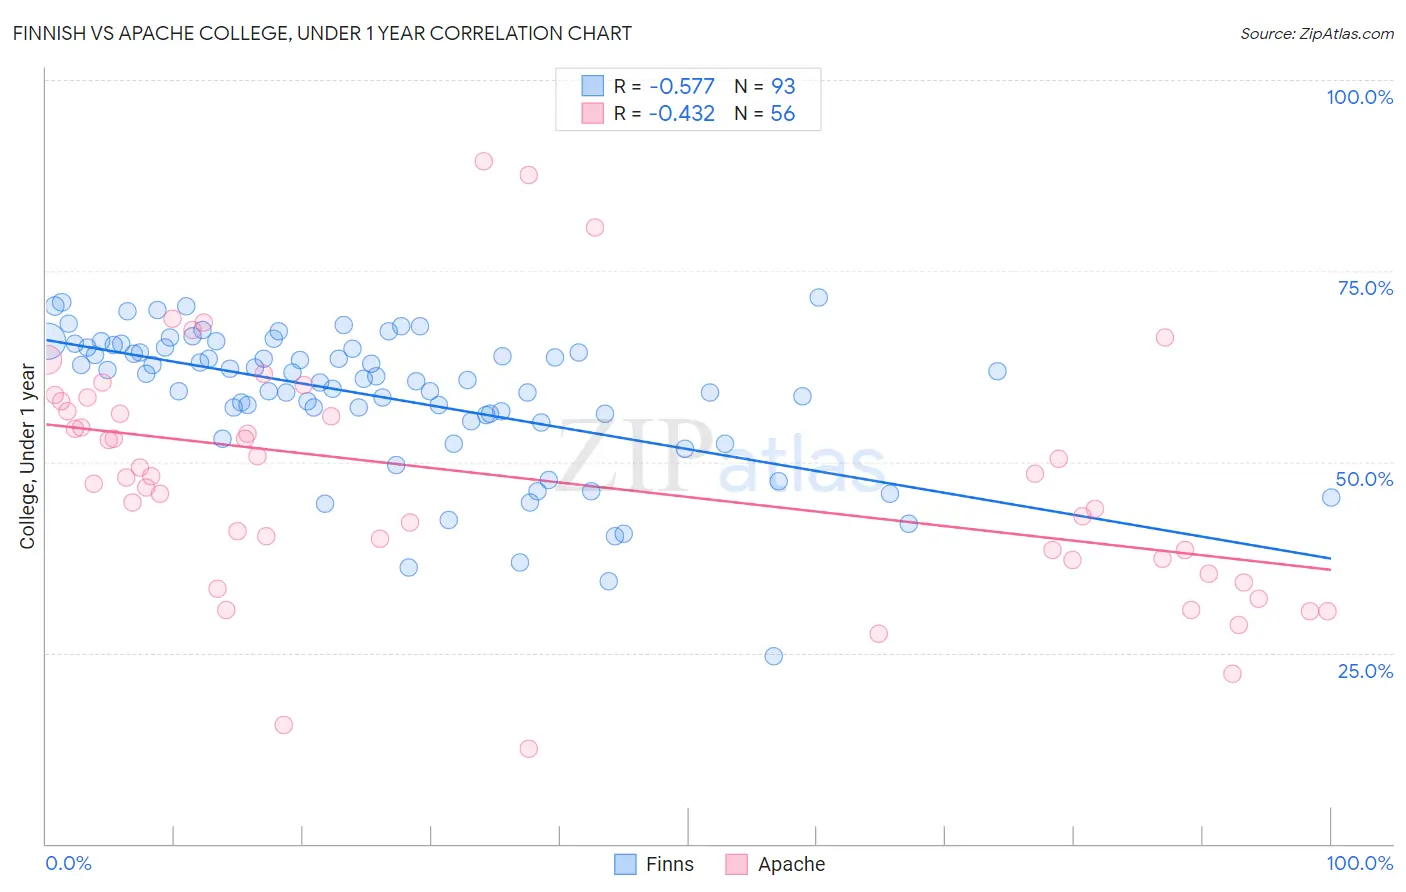
Finnish vs Apache College, Under 1 year Correlation Chart
The statistical analysis conducted on geographies consisting of 404,673,530 people shows a substantial negative correlation between the proportion of Finns and percentage of population with at least college, under 1 year education in the United States with a correlation coefficient (R) of -0.577 and weighted average of 66.9%. Similarly, the statistical analysis conducted on geographies consisting of 231,142,948 people shows a moderate negative correlation between the proportion of Apache and percentage of population with at least college, under 1 year education in the United States with a correlation coefficient (R) of -0.432 and weighted average of 58.0%, a difference of 15.3%.
College, Under 1 year Correlation Summary
| Measurement | Finnish | Apache |
| Minimum | 24.5% | 12.5% |
| Maximum | 71.6% | 89.3% |
| Range | 47.0% | 76.8% |
| Mean | 58.5% | 47.9% |
| Median | 60.9% | 48.0% |
| Interquartile 25% (IQ1) | 55.8% | 37.3% |
| Interquartile 75% (IQ3) | 64.9% | 57.3% |
| Interquartile Range (IQR) | 9.1% | 20.1% |
| Standard Deviation (Sample) | 9.3% | 15.9% |
| Standard Deviation (Population) | 9.2% | 15.7% |
Similar Demographics by College, Under 1 year
Demographics Similar to Finns by College, Under 1 year
In terms of college, under 1 year, the demographic groups most similar to Finns are Polish (66.9%, a difference of 0.020%), Immigrants from Brazil (66.9%, a difference of 0.030%), Immigrants from Syria (66.9%, a difference of 0.040%), Iraqi (66.8%, a difference of 0.060%), and Canadian (66.8%, a difference of 0.070%).
| Demographics | Rating | Rank | College, Under 1 year |
| Arabs | 92.6 /100 | #124 | Exceptional 67.2% |
| Italians | 91.8 /100 | #125 | Exceptional 67.2% |
| Alsatians | 91.3 /100 | #126 | Exceptional 67.1% |
| Czechs | 90.8 /100 | #127 | Exceptional 67.1% |
| Scottish | 90.2 /100 | #128 | Exceptional 67.0% |
| Immigrants | Eastern Africa | 89.5 /100 | #129 | Excellent 67.0% |
| Immigrants | Syria | 89.0 /100 | #130 | Excellent 66.9% |
| Finns | 88.6 /100 | #131 | Excellent 66.9% |
| Poles | 88.4 /100 | #132 | Excellent 66.9% |
| Immigrants | Brazil | 88.3 /100 | #133 | Excellent 66.9% |
| Iraqis | 88.0 /100 | #134 | Excellent 66.8% |
| Canadians | 87.9 /100 | #135 | Excellent 66.8% |
| Ugandans | 87.8 /100 | #136 | Excellent 66.8% |
| Immigrants | Chile | 87.4 /100 | #137 | Excellent 66.8% |
| Immigrants | Italy | 86.9 /100 | #138 | Excellent 66.8% |
Demographics Similar to Apache by College, Under 1 year
In terms of college, under 1 year, the demographic groups most similar to Apache are Mexican American Indian (58.1%, a difference of 0.19%), Immigrants from Dominica (57.9%, a difference of 0.29%), Kiowa (57.8%, a difference of 0.30%), Haitian (57.8%, a difference of 0.42%), and Immigrants from Portugal (57.7%, a difference of 0.62%).
| Demographics | Rating | Rank | College, Under 1 year |
| Immigrants | Grenada | 0.0 /100 | #295 | Tragic 59.1% |
| Central American Indians | 0.0 /100 | #296 | Tragic 59.0% |
| Guyanese | 0.0 /100 | #297 | Tragic 59.0% |
| Immigrants | Ecuador | 0.0 /100 | #298 | Tragic 58.7% |
| Cubans | 0.0 /100 | #299 | Tragic 58.6% |
| Immigrants | Guyana | 0.0 /100 | #300 | Tragic 58.5% |
| Mexican American Indians | 0.0 /100 | #301 | Tragic 58.1% |
| Apache | 0.0 /100 | #302 | Tragic 58.0% |
| Immigrants | Dominica | 0.0 /100 | #303 | Tragic 57.9% |
| Kiowa | 0.0 /100 | #304 | Tragic 57.8% |
| Haitians | 0.0 /100 | #305 | Tragic 57.8% |
| Immigrants | Portugal | 0.0 /100 | #306 | Tragic 57.7% |
| Fijians | 0.0 /100 | #307 | Tragic 57.7% |
| Central Americans | 0.0 /100 | #308 | Tragic 57.7% |
| Immigrants | Nicaragua | 0.0 /100 | #309 | Tragic 57.6% |