Puget Sound Salish vs Scottish Median Household Income
COMPARE
Puget Sound Salish
Scottish
Median Household Income
Median Household Income Comparison
Puget Sound Salish
Scottish
$84,011
MEDIAN HOUSEHOLD INCOME
33.2/ 100
METRIC RATING
186th/ 347
METRIC RANK
$85,101
MEDIAN HOUSEHOLD INCOME
50.0/ 100
METRIC RATING
174th/ 347
METRIC RANK
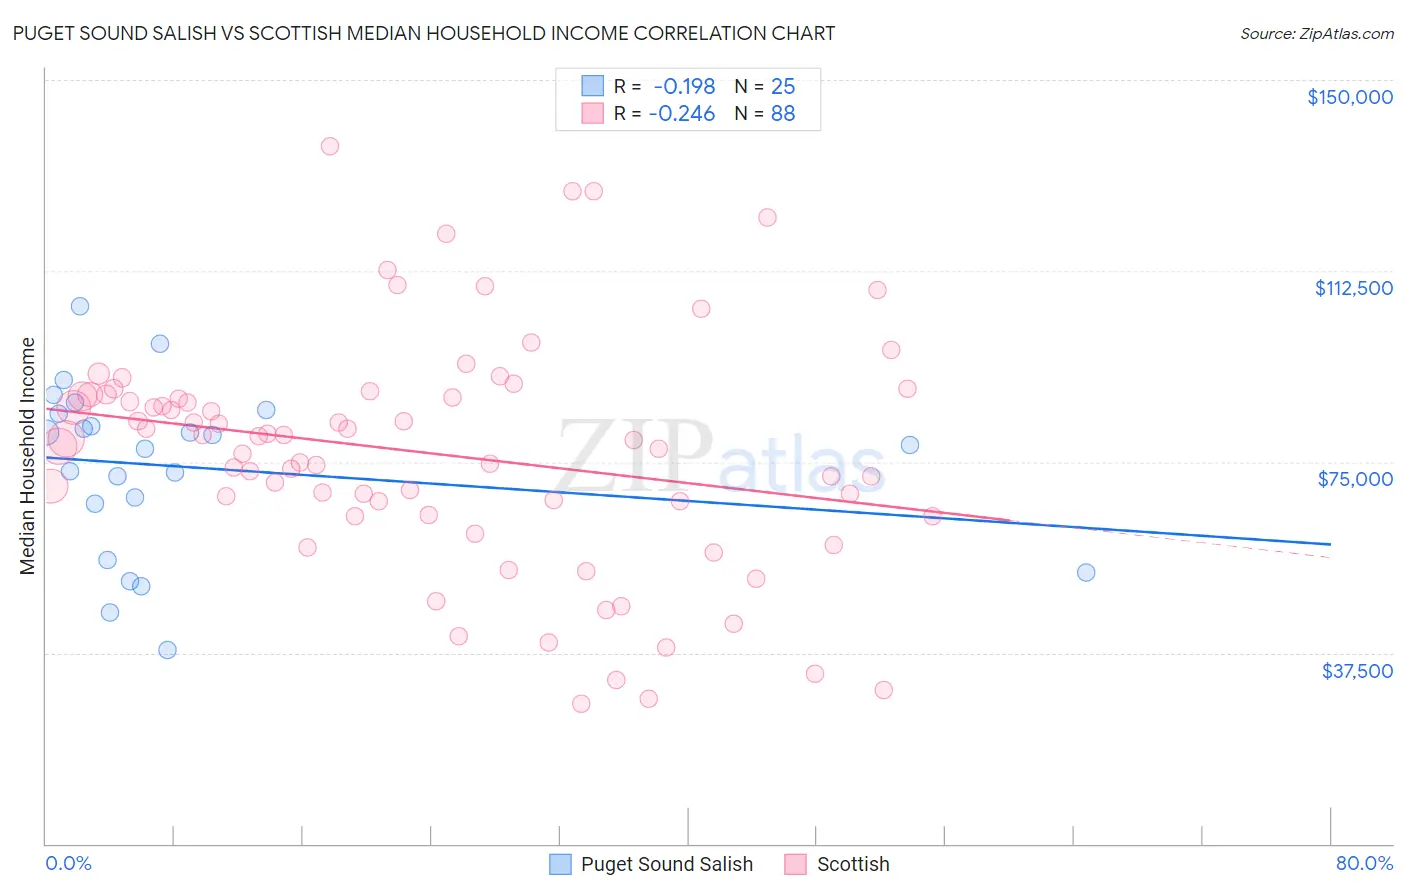
Puget Sound Salish vs Scottish Median Household Income Correlation Chart
The statistical analysis conducted on geographies consisting of 46,152,941 people shows a poor negative correlation between the proportion of Puget Sound Salish and median household income in the United States with a correlation coefficient (R) of -0.198 and weighted average of $84,011. Similarly, the statistical analysis conducted on geographies consisting of 566,054,944 people shows a weak negative correlation between the proportion of Scottish and median household income in the United States with a correlation coefficient (R) of -0.246 and weighted average of $85,101, a difference of 1.3%.
Median Household Income Correlation Summary
| Measurement | Puget Sound Salish | Scottish |
| Minimum | $37,964 | $27,500 |
| Maximum | $105,684 | $136,980 |
| Range | $67,720 | $109,480 |
| Mean | $73,927 | $76,735 |
| Median | $78,333 | $79,406 |
| Interquartile 25% (IQ1) | $61,302 | $65,944 |
| Interquartile 75% (IQ3) | $84,790 | $88,035 |
| Interquartile Range (IQR) | $23,488 | $22,091 |
| Standard Deviation (Sample) | $16,803 | $22,770 |
| Standard Deviation (Population) | $16,464 | $22,640 |
Demographics Similar to Puget Sound Salish and Scottish by Median Household Income
In terms of median household income, the demographic groups most similar to Puget Sound Salish are Belgian ($84,008, a difference of 0.0%), Tlingit-Haida ($83,968, a difference of 0.050%), Kenyan ($84,085, a difference of 0.090%), Immigrants from Colombia ($83,902, a difference of 0.13%), and Slovak ($83,798, a difference of 0.25%). Similarly, the demographic groups most similar to Scottish are Immigrants from Costa Rica ($85,054, a difference of 0.050%), Alsatian ($85,053, a difference of 0.060%), Immigrants from Eritrea ($85,025, a difference of 0.090%), Czechoslovakian ($84,965, a difference of 0.16%), and English ($84,915, a difference of 0.22%).
| Demographics | Rating | Rank | Median Household Income |
| Swiss | 59.2 /100 | #170 | Average $85,681 |
| Immigrants | South America | 58.1 /100 | #171 | Average $85,611 |
| Slovenes | 57.4 /100 | #172 | Average $85,562 |
| Immigrants | Cameroon | 53.4 /100 | #173 | Average $85,314 |
| Scottish | 50.0 /100 | #174 | Average $85,101 |
| Immigrants | Costa Rica | 49.2 /100 | #175 | Average $85,054 |
| Alsatians | 49.2 /100 | #176 | Average $85,053 |
| Immigrants | Eritrea | 48.8 /100 | #177 | Average $85,025 |
| Czechoslovakians | 47.8 /100 | #178 | Average $84,965 |
| English | 47.0 /100 | #179 | Average $84,915 |
| Immigrants | Portugal | 44.2 /100 | #180 | Average $84,740 |
| Hawaiians | 44.1 /100 | #181 | Average $84,729 |
| Uruguayans | 43.5 /100 | #182 | Average $84,691 |
| Spaniards | 42.7 /100 | #183 | Average $84,644 |
| Immigrants | Eastern Africa | 37.4 /100 | #184 | Fair $84,299 |
| Kenyans | 34.2 /100 | #185 | Fair $84,085 |
| Puget Sound Salish | 33.2 /100 | #186 | Fair $84,011 |
| Belgians | 33.2 /100 | #187 | Fair $84,008 |
| Tlingit-Haida | 32.6 /100 | #188 | Fair $83,968 |
| Immigrants | Colombia | 31.7 /100 | #189 | Fair $83,902 |
| Slovaks | 30.2 /100 | #190 | Fair $83,798 |