Shoshone vs Scottish Median Household Income
COMPARE
Shoshone
Scottish
Median Household Income
Median Household Income Comparison
Shoshone
Scottish
$72,660
MEDIAN HOUSEHOLD INCOME
0.0/ 100
METRIC RATING
302nd/ 347
METRIC RANK
$85,101
MEDIAN HOUSEHOLD INCOME
50.0/ 100
METRIC RATING
174th/ 347
METRIC RANK
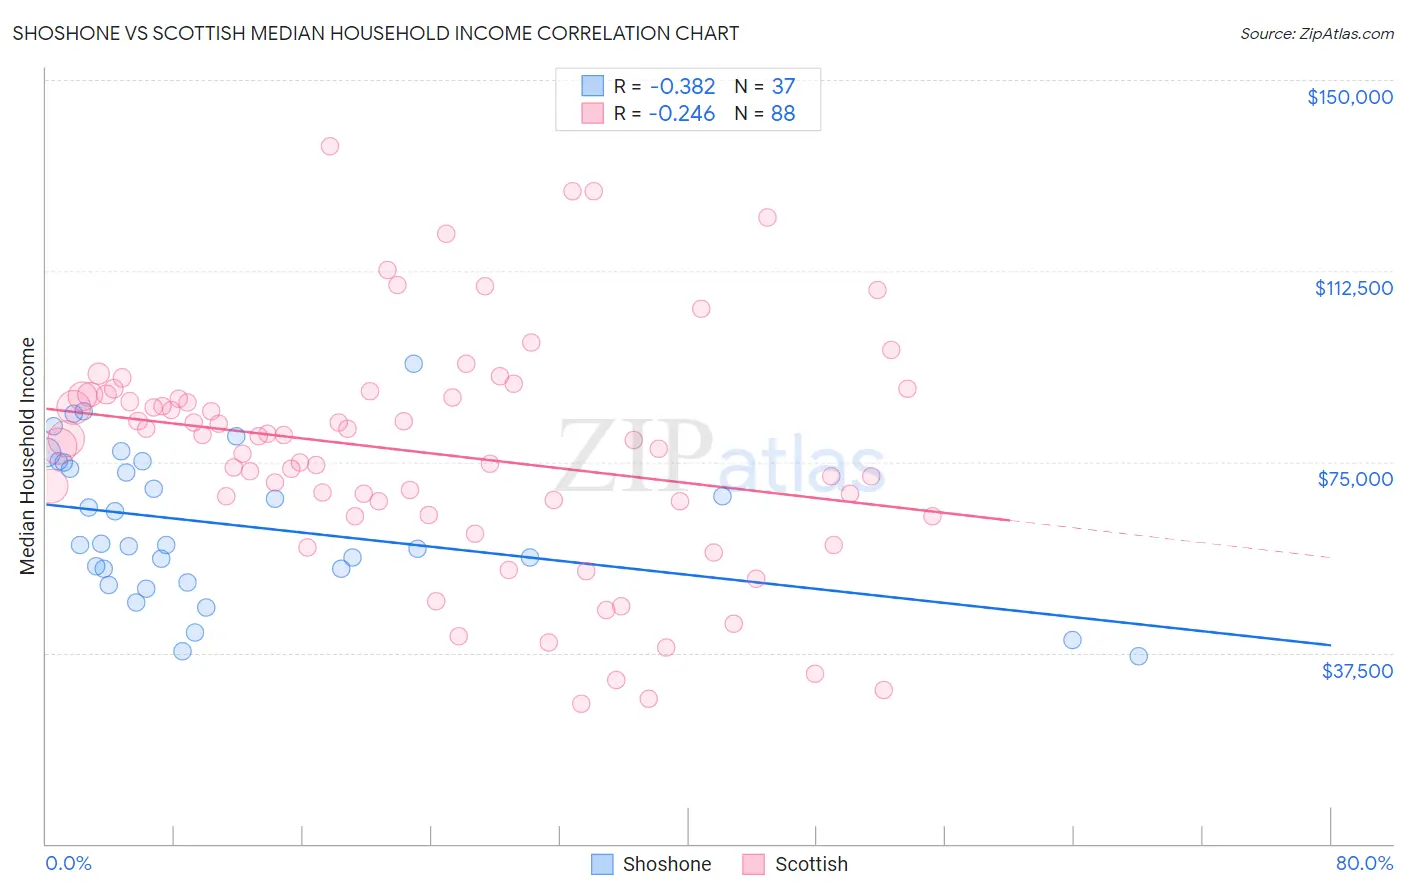
Shoshone vs Scottish Median Household Income Correlation Chart
The statistical analysis conducted on geographies consisting of 66,612,449 people shows a mild negative correlation between the proportion of Shoshone and median household income in the United States with a correlation coefficient (R) of -0.382 and weighted average of $72,660. Similarly, the statistical analysis conducted on geographies consisting of 566,054,944 people shows a weak negative correlation between the proportion of Scottish and median household income in the United States with a correlation coefficient (R) of -0.246 and weighted average of $85,101, a difference of 17.1%.
Median Household Income Correlation Summary
| Measurement | Shoshone | Scottish |
| Minimum | $36,823 | $27,500 |
| Maximum | $94,375 | $136,980 |
| Range | $57,552 | $109,480 |
| Mean | $62,559 | $76,735 |
| Median | $58,750 | $79,406 |
| Interquartile 25% (IQ1) | $52,629 | $65,944 |
| Interquartile 75% (IQ3) | $75,002 | $88,035 |
| Interquartile Range (IQR) | $22,372 | $22,091 |
| Standard Deviation (Sample) | $14,416 | $22,770 |
| Standard Deviation (Population) | $14,219 | $22,640 |
Similar Demographics by Median Household Income
Demographics Similar to Shoshone by Median Household Income
In terms of median household income, the demographic groups most similar to Shoshone are African ($72,650, a difference of 0.010%), Cherokee ($72,682, a difference of 0.030%), Immigrants from Haiti ($72,599, a difference of 0.080%), Honduran ($72,588, a difference of 0.10%), and Potawatomi ($72,576, a difference of 0.12%).
| Demographics | Rating | Rank | Median Household Income |
| Cubans | 0.1 /100 | #295 | Tragic $73,392 |
| Haitians | 0.1 /100 | #296 | Tragic $73,306 |
| Immigrants | Mexico | 0.0 /100 | #297 | Tragic $73,160 |
| Paiute | 0.0 /100 | #298 | Tragic $72,959 |
| Indonesians | 0.0 /100 | #299 | Tragic $72,856 |
| Immigrants | Dominica | 0.0 /100 | #300 | Tragic $72,760 |
| Cherokee | 0.0 /100 | #301 | Tragic $72,682 |
| Shoshone | 0.0 /100 | #302 | Tragic $72,660 |
| Africans | 0.0 /100 | #303 | Tragic $72,650 |
| Immigrants | Haiti | 0.0 /100 | #304 | Tragic $72,599 |
| Hondurans | 0.0 /100 | #305 | Tragic $72,588 |
| Potawatomi | 0.0 /100 | #306 | Tragic $72,576 |
| Ute | 0.0 /100 | #307 | Tragic $72,402 |
| Yakama | 0.0 /100 | #308 | Tragic $72,225 |
| Immigrants | Caribbean | 0.0 /100 | #309 | Tragic $71,860 |
Demographics Similar to Scottish by Median Household Income
In terms of median household income, the demographic groups most similar to Scottish are Immigrants from Costa Rica ($85,054, a difference of 0.050%), Alsatian ($85,053, a difference of 0.060%), Immigrants from Eritrea ($85,025, a difference of 0.090%), Czechoslovakian ($84,965, a difference of 0.16%), and English ($84,915, a difference of 0.22%).
| Demographics | Rating | Rank | Median Household Income |
| Immigrants | Immigrants | 61.3 /100 | #167 | Good $85,818 |
| Icelanders | 61.0 /100 | #168 | Good $85,797 |
| Colombians | 59.7 /100 | #169 | Average $85,716 |
| Swiss | 59.2 /100 | #170 | Average $85,681 |
| Immigrants | South America | 58.1 /100 | #171 | Average $85,611 |
| Slovenes | 57.4 /100 | #172 | Average $85,562 |
| Immigrants | Cameroon | 53.4 /100 | #173 | Average $85,314 |
| Scottish | 50.0 /100 | #174 | Average $85,101 |
| Immigrants | Costa Rica | 49.2 /100 | #175 | Average $85,054 |
| Alsatians | 49.2 /100 | #176 | Average $85,053 |
| Immigrants | Eritrea | 48.8 /100 | #177 | Average $85,025 |
| Czechoslovakians | 47.8 /100 | #178 | Average $84,965 |
| English | 47.0 /100 | #179 | Average $84,915 |
| Immigrants | Portugal | 44.2 /100 | #180 | Average $84,740 |
| Hawaiians | 44.1 /100 | #181 | Average $84,729 |