Immigrants from Belgium vs Lebanese Median Household Income
COMPARE
Immigrants from Belgium
Lebanese
Median Household Income
Median Household Income Comparison
Immigrants from Belgium
Lebanese
$100,306
MEDIAN HOUSEHOLD INCOME
100.0/ 100
METRIC RATING
26th/ 347
METRIC RANK
$88,091
MEDIAN HOUSEHOLD INCOME
87.2/ 100
METRIC RATING
140th/ 347
METRIC RANK
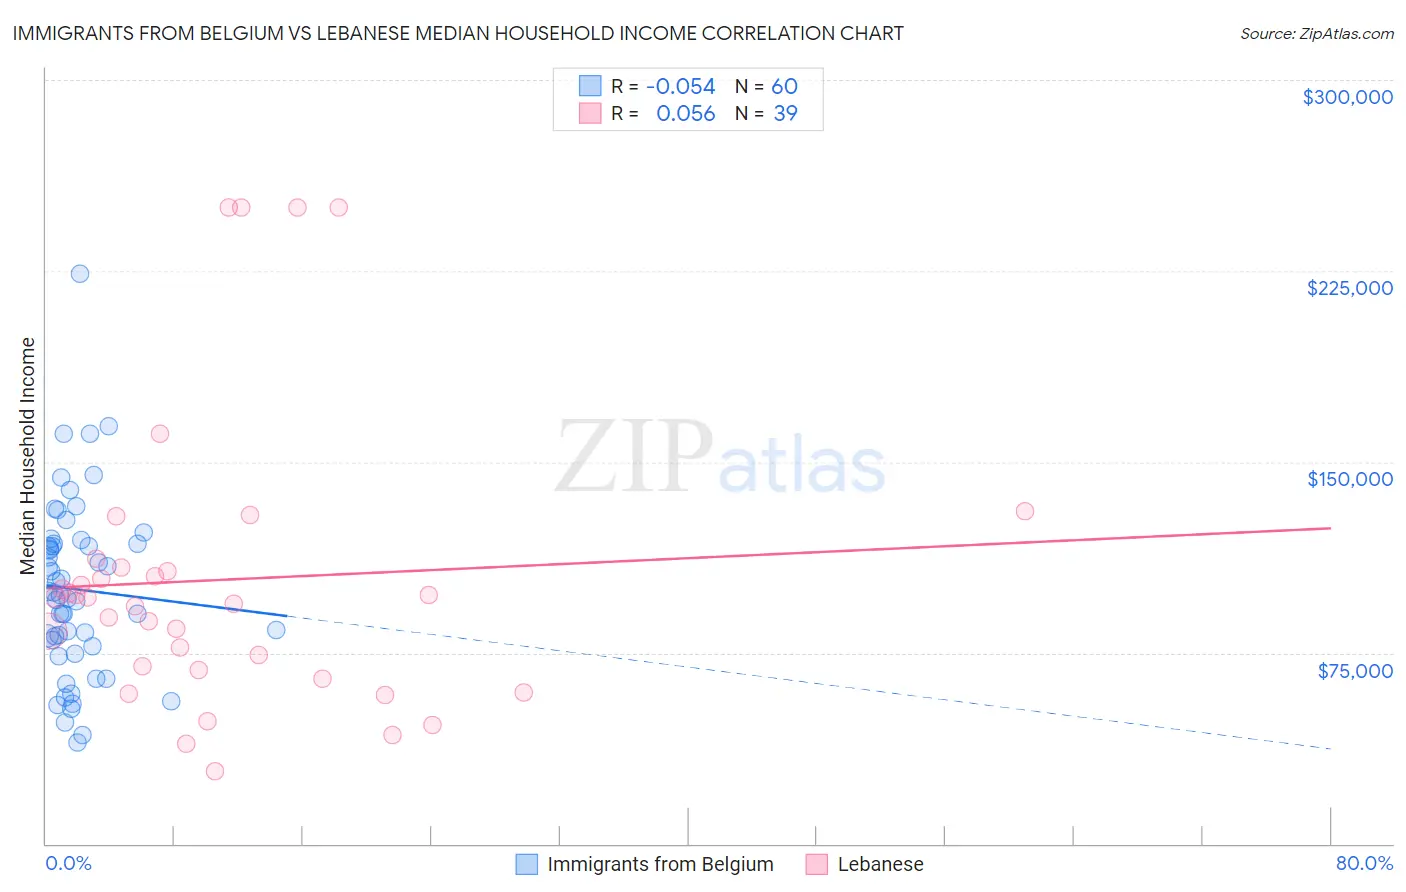
Immigrants from Belgium vs Lebanese Median Household Income Correlation Chart
The statistical analysis conducted on geographies consisting of 146,650,493 people shows a slight negative correlation between the proportion of Immigrants from Belgium and median household income in the United States with a correlation coefficient (R) of -0.054 and weighted average of $100,306. Similarly, the statistical analysis conducted on geographies consisting of 401,232,119 people shows a slight positive correlation between the proportion of Lebanese and median household income in the United States with a correlation coefficient (R) of 0.056 and weighted average of $88,091, a difference of 13.9%.
Median Household Income Correlation Summary
| Measurement | Immigrants from Belgium | Lebanese |
| Minimum | $39,542 | $28,348 |
| Maximum | $223,750 | $250,001 |
| Range | $184,208 | $221,653 |
| Mean | $99,959 | $103,665 |
| Median | $98,272 | $96,621 |
| Interquartile 25% (IQ1) | $78,898 | $68,125 |
| Interquartile 75% (IQ3) | $117,778 | $108,387 |
| Interquartile Range (IQR) | $38,881 | $40,262 |
| Standard Deviation (Sample) | $34,343 | $57,143 |
| Standard Deviation (Population) | $34,056 | $56,406 |
Similar Demographics by Median Household Income
Demographics Similar to Immigrants from Belgium by Median Household Income
In terms of median household income, the demographic groups most similar to Immigrants from Belgium are Bhutanese ($100,151, a difference of 0.15%), Immigrants from Sri Lanka ($99,943, a difference of 0.36%), Immigrants from Asia ($99,933, a difference of 0.37%), Immigrants from Sweden ($100,699, a difference of 0.39%), and Immigrants from Japan ($100,711, a difference of 0.40%).
| Demographics | Rating | Rank | Median Household Income |
| Immigrants | Australia | 100.0 /100 | #19 | Exceptional $102,562 |
| Bolivians | 100.0 /100 | #20 | Exceptional $102,195 |
| Eastern Europeans | 100.0 /100 | #21 | Exceptional $101,781 |
| Asians | 100.0 /100 | #22 | Exceptional $101,681 |
| Immigrants | Bolivia | 100.0 /100 | #23 | Exceptional $101,394 |
| Immigrants | Japan | 100.0 /100 | #24 | Exceptional $100,711 |
| Immigrants | Sweden | 100.0 /100 | #25 | Exceptional $100,699 |
| Immigrants | Belgium | 100.0 /100 | #26 | Exceptional $100,306 |
| Bhutanese | 100.0 /100 | #27 | Exceptional $100,151 |
| Immigrants | Sri Lanka | 100.0 /100 | #28 | Exceptional $99,943 |
| Immigrants | Asia | 100.0 /100 | #29 | Exceptional $99,933 |
| Immigrants | Northern Europe | 100.0 /100 | #30 | Exceptional $99,813 |
| Turks | 100.0 /100 | #31 | Exceptional $99,389 |
| Immigrants | Denmark | 100.0 /100 | #32 | Exceptional $98,510 |
| Chinese | 100.0 /100 | #33 | Exceptional $98,496 |
Demographics Similar to Lebanese by Median Household Income
In terms of median household income, the demographic groups most similar to Lebanese are Immigrants from Morocco ($87,930, a difference of 0.18%), Immigrants from Chile ($88,388, a difference of 0.34%), Arab ($88,398, a difference of 0.35%), Canadian ($87,769, a difference of 0.37%), and Sierra Leonean ($88,463, a difference of 0.42%).
| Demographics | Rating | Rank | Median Household Income |
| Immigrants | Ethiopia | 90.9 /100 | #133 | Exceptional $88,687 |
| Swedes | 90.0 /100 | #134 | Exceptional $88,524 |
| Immigrants | Sierra Leone | 89.9 /100 | #135 | Excellent $88,498 |
| Poles | 89.7 /100 | #136 | Excellent $88,472 |
| Sierra Leoneans | 89.6 /100 | #137 | Excellent $88,463 |
| Arabs | 89.2 /100 | #138 | Excellent $88,398 |
| Immigrants | Chile | 89.2 /100 | #139 | Excellent $88,388 |
| Lebanese | 87.2 /100 | #140 | Excellent $88,091 |
| Immigrants | Morocco | 86.0 /100 | #141 | Excellent $87,930 |
| Canadians | 84.7 /100 | #142 | Excellent $87,769 |
| Danes | 83.9 /100 | #143 | Excellent $87,676 |
| Serbians | 83.0 /100 | #144 | Excellent $87,572 |
| Ugandans | 82.9 /100 | #145 | Excellent $87,557 |
| Immigrants | Uganda | 82.8 /100 | #146 | Excellent $87,553 |
| South American Indians | 81.8 /100 | #147 | Excellent $87,446 |