Ethiopian vs Immigrants from Moldova Median Male Earnings
COMPARE
Ethiopian
Immigrants from Moldova
Median Male Earnings
Median Male Earnings Comparison
Ethiopians
Immigrants from Moldova
$56,243
MEDIAN MALE EARNINGS
84.8/ 100
METRIC RATING
142nd/ 347
METRIC RANK
$59,417
MEDIAN MALE EARNINGS
99.2/ 100
METRIC RATING
89th/ 347
METRIC RANK
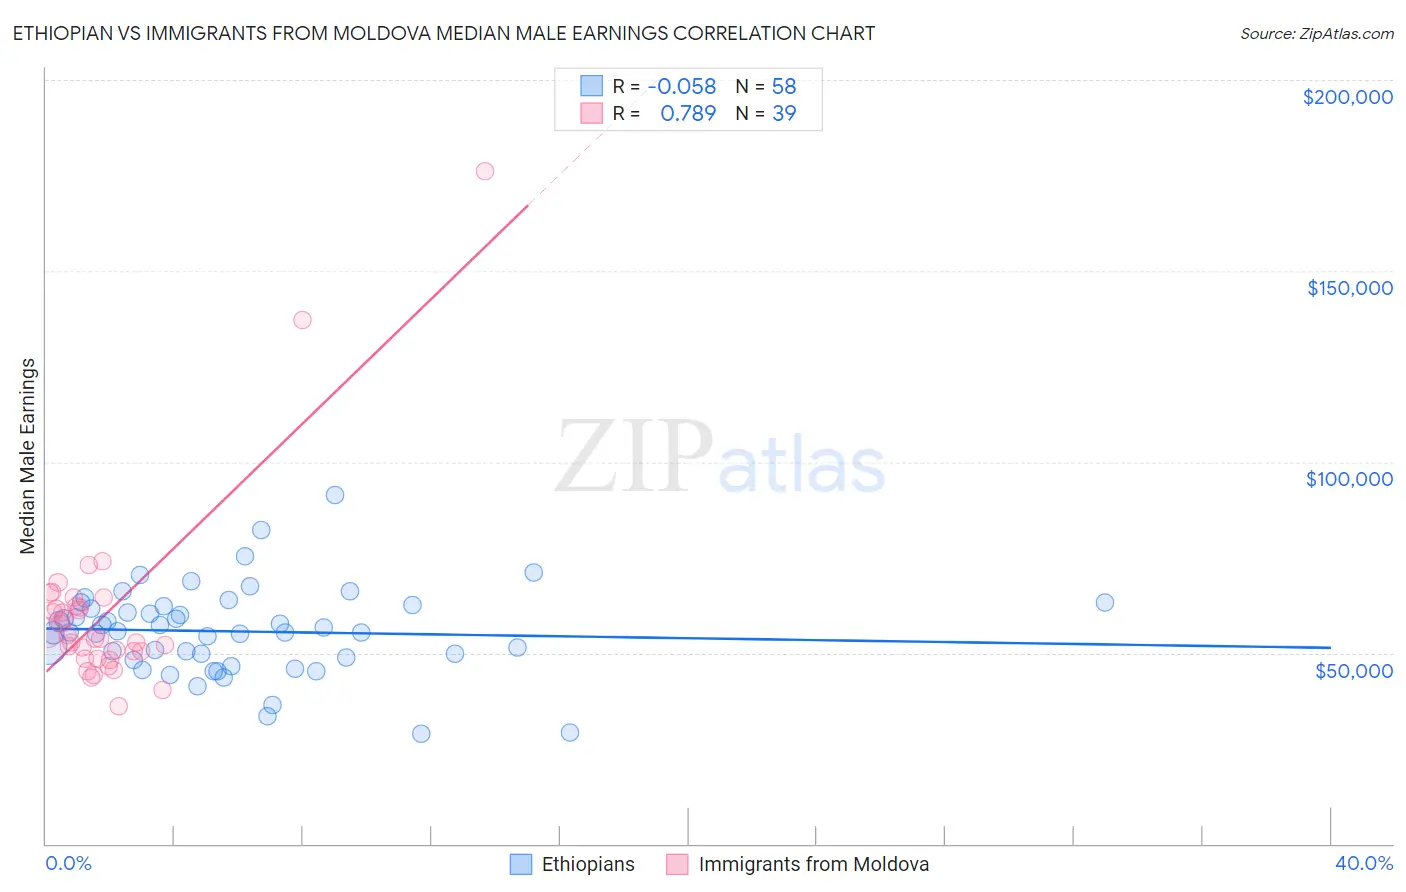
Ethiopian vs Immigrants from Moldova Median Male Earnings Correlation Chart
The statistical analysis conducted on geographies consisting of 223,246,505 people shows a slight negative correlation between the proportion of Ethiopians and median male earnings in the United States with a correlation coefficient (R) of -0.058 and weighted average of $56,243. Similarly, the statistical analysis conducted on geographies consisting of 124,394,604 people shows a strong positive correlation between the proportion of Immigrants from Moldova and median male earnings in the United States with a correlation coefficient (R) of 0.789 and weighted average of $59,417, a difference of 5.6%.
Median Male Earnings Correlation Summary
| Measurement | Ethiopian | Immigrants from Moldova |
| Minimum | $28,882 | $35,909 |
| Maximum | $91,333 | $176,076 |
| Range | $62,451 | $140,167 |
| Mean | $55,598 | $60,240 |
| Median | $55,634 | $53,815 |
| Interquartile 25% (IQ1) | $48,793 | $48,477 |
| Interquartile 75% (IQ3) | $62,132 | $62,160 |
| Interquartile Range (IQR) | $13,339 | $13,683 |
| Standard Deviation (Sample) | $11,505 | $24,701 |
| Standard Deviation (Population) | $11,405 | $24,383 |
Similar Demographics by Median Male Earnings
Demographics Similar to Ethiopians by Median Male Earnings
In terms of median male earnings, the demographic groups most similar to Ethiopians are Danish ($56,246, a difference of 0.0%), Zimbabwean ($56,302, a difference of 0.10%), Luxembourger ($56,300, a difference of 0.10%), Slovak ($56,306, a difference of 0.11%), and Sri Lankan ($56,136, a difference of 0.19%).
| Demographics | Rating | Rank | Median Male Earnings |
| Irish | 87.4 /100 | #135 | Excellent $56,464 |
| Immigrants | Saudi Arabia | 87.2 /100 | #136 | Excellent $56,452 |
| Slavs | 86.5 /100 | #137 | Excellent $56,390 |
| Slovaks | 85.5 /100 | #138 | Excellent $56,306 |
| Zimbabweans | 85.5 /100 | #139 | Excellent $56,302 |
| Luxembourgers | 85.5 /100 | #140 | Excellent $56,300 |
| Danes | 84.8 /100 | #141 | Excellent $56,246 |
| Ethiopians | 84.8 /100 | #142 | Excellent $56,243 |
| Sri Lankans | 83.4 /100 | #143 | Excellent $56,136 |
| Immigrants | Uganda | 82.4 /100 | #144 | Excellent $56,064 |
| Norwegians | 80.9 /100 | #145 | Excellent $55,965 |
| Immigrants | Chile | 80.7 /100 | #146 | Excellent $55,954 |
| Immigrants | Philippines | 78.4 /100 | #147 | Good $55,809 |
| Scottish | 78.2 /100 | #148 | Good $55,793 |
| English | 77.4 /100 | #149 | Good $55,747 |
Demographics Similar to Immigrants from Moldova by Median Male Earnings
In terms of median male earnings, the demographic groups most similar to Immigrants from Moldova are Austrian ($59,359, a difference of 0.10%), Laotian ($59,351, a difference of 0.11%), Immigrants from Argentina ($59,491, a difference of 0.12%), Immigrants from England ($59,527, a difference of 0.18%), and Macedonian ($59,522, a difference of 0.18%).
| Demographics | Rating | Rank | Median Male Earnings |
| Croatians | 99.4 /100 | #82 | Exceptional $59,715 |
| Immigrants | Italy | 99.4 /100 | #83 | Exceptional $59,691 |
| Afghans | 99.3 /100 | #84 | Exceptional $59,554 |
| Italians | 99.3 /100 | #85 | Exceptional $59,551 |
| Immigrants | England | 99.3 /100 | #86 | Exceptional $59,527 |
| Macedonians | 99.3 /100 | #87 | Exceptional $59,522 |
| Immigrants | Argentina | 99.3 /100 | #88 | Exceptional $59,491 |
| Immigrants | Moldova | 99.2 /100 | #89 | Exceptional $59,417 |
| Austrians | 99.2 /100 | #90 | Exceptional $59,359 |
| Laotians | 99.2 /100 | #91 | Exceptional $59,351 |
| Immigrants | Kazakhstan | 99.1 /100 | #92 | Exceptional $59,278 |
| Immigrants | Southern Europe | 99.0 /100 | #93 | Exceptional $59,217 |
| Immigrants | North Macedonia | 99.0 /100 | #94 | Exceptional $59,189 |
| Immigrants | Lebanon | 98.6 /100 | #95 | Exceptional $58,835 |
| Albanians | 98.4 /100 | #96 | Exceptional $58,680 |