Ethiopian vs Canadian Median Male Earnings
COMPARE
Ethiopian
Canadian
Median Male Earnings
Median Male Earnings Comparison
Ethiopians
Canadians
$56,243
MEDIAN MALE EARNINGS
84.8/ 100
METRIC RATING
142nd/ 347
METRIC RANK
$57,286
MEDIAN MALE EARNINGS
93.9/ 100
METRIC RATING
120th/ 347
METRIC RANK
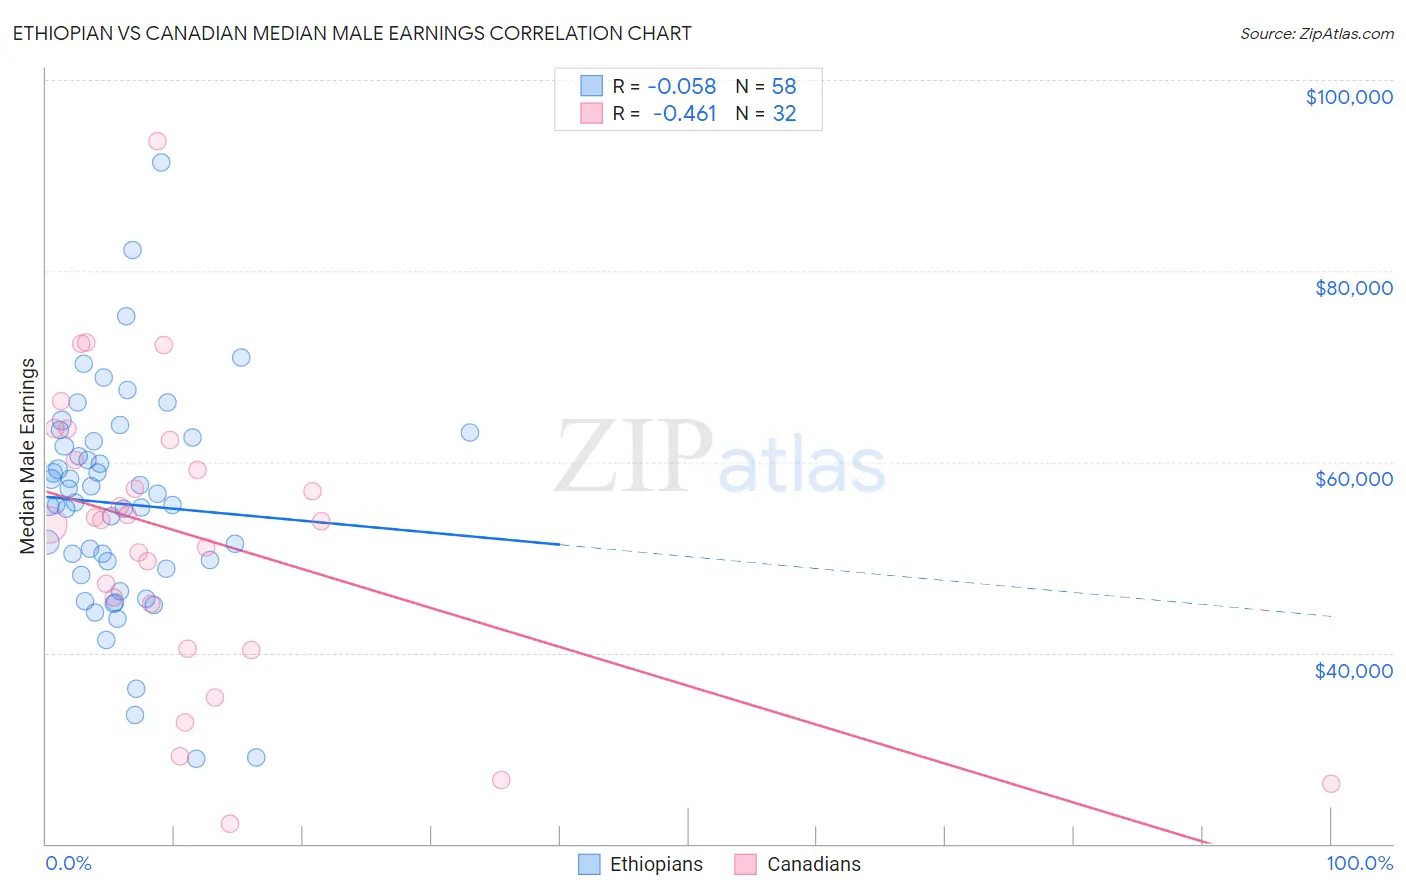
Ethiopian vs Canadian Median Male Earnings Correlation Chart
The statistical analysis conducted on geographies consisting of 223,246,505 people shows a slight negative correlation between the proportion of Ethiopians and median male earnings in the United States with a correlation coefficient (R) of -0.058 and weighted average of $56,243. Similarly, the statistical analysis conducted on geographies consisting of 437,343,758 people shows a moderate negative correlation between the proportion of Canadians and median male earnings in the United States with a correlation coefficient (R) of -0.461 and weighted average of $57,286, a difference of 1.8%.
Median Male Earnings Correlation Summary
| Measurement | Ethiopian | Canadian |
| Minimum | $28,882 | $22,125 |
| Maximum | $91,333 | $93,638 |
| Range | $62,451 | $71,513 |
| Mean | $55,598 | $52,093 |
| Median | $55,634 | $53,822 |
| Interquartile 25% (IQ1) | $48,793 | $42,789 |
| Interquartile 75% (IQ3) | $62,132 | $61,239 |
| Interquartile Range (IQR) | $13,339 | $18,449 |
| Standard Deviation (Sample) | $11,505 | $15,572 |
| Standard Deviation (Population) | $11,405 | $15,327 |
Similar Demographics by Median Male Earnings
Demographics Similar to Ethiopians by Median Male Earnings
In terms of median male earnings, the demographic groups most similar to Ethiopians are Danish ($56,246, a difference of 0.0%), Zimbabwean ($56,302, a difference of 0.10%), Luxembourger ($56,300, a difference of 0.10%), Slovak ($56,306, a difference of 0.11%), and Sri Lankan ($56,136, a difference of 0.19%).
| Demographics | Rating | Rank | Median Male Earnings |
| Irish | 87.4 /100 | #135 | Excellent $56,464 |
| Immigrants | Saudi Arabia | 87.2 /100 | #136 | Excellent $56,452 |
| Slavs | 86.5 /100 | #137 | Excellent $56,390 |
| Slovaks | 85.5 /100 | #138 | Excellent $56,306 |
| Zimbabweans | 85.5 /100 | #139 | Excellent $56,302 |
| Luxembourgers | 85.5 /100 | #140 | Excellent $56,300 |
| Danes | 84.8 /100 | #141 | Excellent $56,246 |
| Ethiopians | 84.8 /100 | #142 | Excellent $56,243 |
| Sri Lankans | 83.4 /100 | #143 | Excellent $56,136 |
| Immigrants | Uganda | 82.4 /100 | #144 | Excellent $56,064 |
| Norwegians | 80.9 /100 | #145 | Excellent $55,965 |
| Immigrants | Chile | 80.7 /100 | #146 | Excellent $55,954 |
| Immigrants | Philippines | 78.4 /100 | #147 | Good $55,809 |
| Scottish | 78.2 /100 | #148 | Good $55,793 |
| English | 77.4 /100 | #149 | Good $55,747 |
Demographics Similar to Canadians by Median Male Earnings
In terms of median male earnings, the demographic groups most similar to Canadians are Arab ($57,298, a difference of 0.020%), Hungarian ($57,309, a difference of 0.040%), Immigrants from Zimbabwe ($57,352, a difference of 0.12%), Immigrants from Albania ($57,179, a difference of 0.19%), and Lebanese ($57,409, a difference of 0.22%).
| Demographics | Rating | Rank | Median Male Earnings |
| Carpatho Rusyns | 95.3 /100 | #113 | Exceptional $57,572 |
| Immigrants | Kuwait | 95.3 /100 | #114 | Exceptional $57,562 |
| Swedes | 94.8 /100 | #115 | Exceptional $57,445 |
| Lebanese | 94.6 /100 | #116 | Exceptional $57,409 |
| Immigrants | Zimbabwe | 94.3 /100 | #117 | Exceptional $57,352 |
| Hungarians | 94.0 /100 | #118 | Exceptional $57,309 |
| Arabs | 94.0 /100 | #119 | Exceptional $57,298 |
| Canadians | 93.9 /100 | #120 | Exceptional $57,286 |
| Immigrants | Albania | 93.3 /100 | #121 | Exceptional $57,179 |
| Immigrants | Jordan | 93.1 /100 | #122 | Exceptional $57,145 |
| Slovenes | 93.1 /100 | #123 | Exceptional $57,145 |
| Chileans | 91.9 /100 | #124 | Exceptional $56,973 |
| Immigrants | Morocco | 91.8 /100 | #125 | Exceptional $56,958 |
| Chinese | 91.1 /100 | #126 | Exceptional $56,872 |
| Brazilians | 90.9 /100 | #127 | Exceptional $56,837 |