Ethiopian vs Immigrants from Eritrea In Labor Force | Age 25-29
COMPARE
Ethiopian
Immigrants from Eritrea
In Labor Force | Age 25-29
In Labor Force | Age 25-29 Comparison
Ethiopians
Immigrants from Eritrea
86.2%
IN LABOR FORCE | AGE 25-29
100.0/ 100
METRIC RATING
9th/ 347
METRIC RANK
85.7%
IN LABOR FORCE | AGE 25-29
99.9/ 100
METRIC RATING
42nd/ 347
METRIC RANK
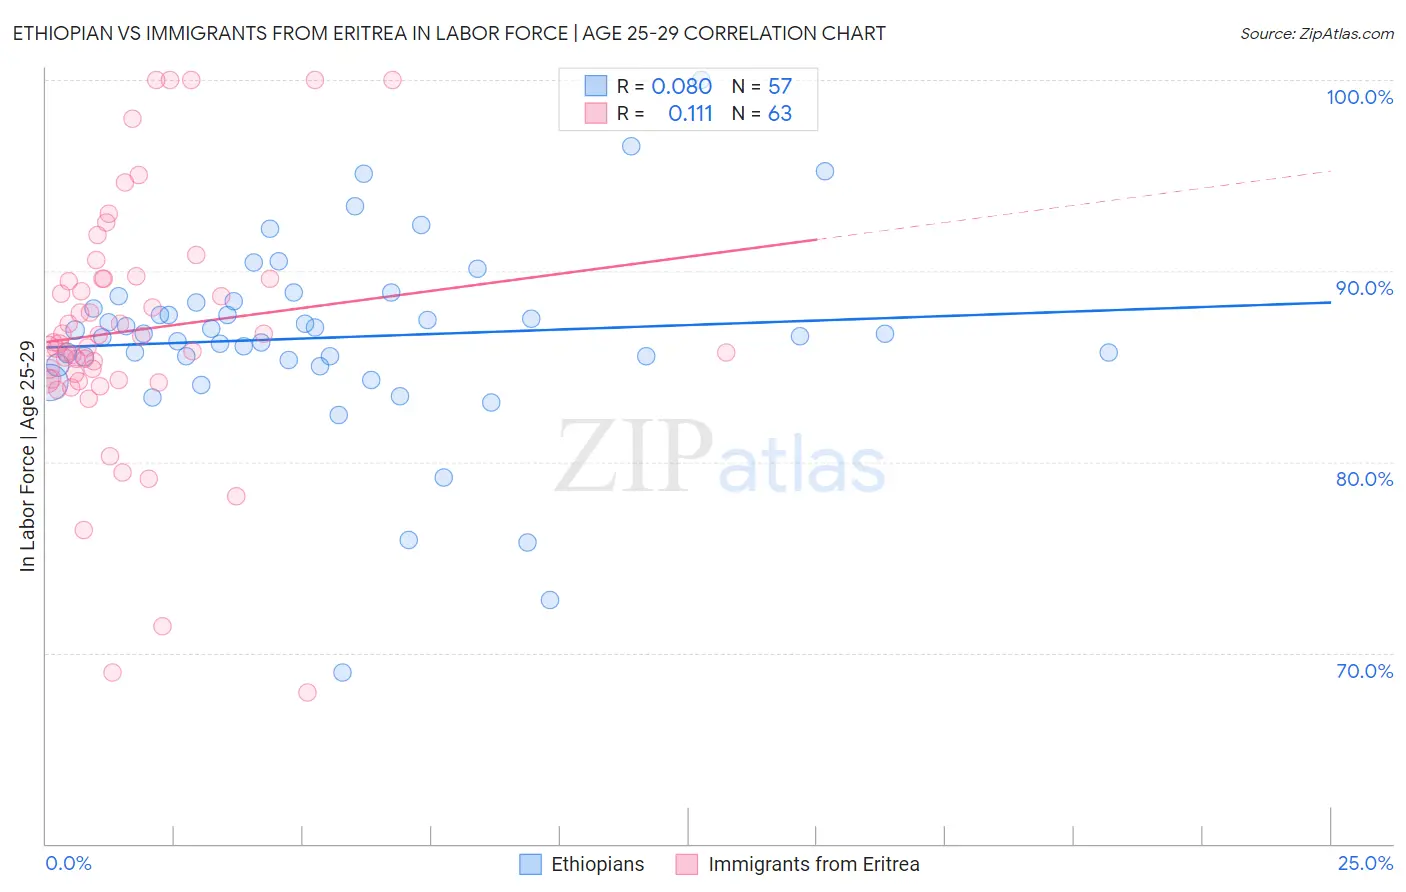
Ethiopian vs Immigrants from Eritrea In Labor Force | Age 25-29 Correlation Chart
The statistical analysis conducted on geographies consisting of 223,220,126 people shows a slight positive correlation between the proportion of Ethiopians and labor force participation rate among population between the ages 25 and 29 in the United States with a correlation coefficient (R) of 0.080 and weighted average of 86.2%. Similarly, the statistical analysis conducted on geographies consisting of 104,848,070 people shows a poor positive correlation between the proportion of Immigrants from Eritrea and labor force participation rate among population between the ages 25 and 29 in the United States with a correlation coefficient (R) of 0.111 and weighted average of 85.7%, a difference of 0.56%.
In Labor Force | Age 25-29 Correlation Summary
| Measurement | Ethiopian | Immigrants from Eritrea |
| Minimum | 69.0% | 67.9% |
| Maximum | 100.0% | 100.0% |
| Range | 31.0% | 32.1% |
| Mean | 86.5% | 86.9% |
| Median | 86.7% | 86.2% |
| Interquartile 25% (IQ1) | 85.2% | 84.3% |
| Interquartile 75% (IQ3) | 88.4% | 89.6% |
| Interquartile Range (IQR) | 3.2% | 5.3% |
| Standard Deviation (Sample) | 5.1% | 6.5% |
| Standard Deviation (Population) | 5.1% | 6.5% |
Similar Demographics by In Labor Force | Age 25-29
Demographics Similar to Ethiopians by In Labor Force | Age 25-29
In terms of in labor force | age 25-29, the demographic groups most similar to Ethiopians are Immigrants from Cabo Verde (86.2%, a difference of 0.030%), Liberian (86.1%, a difference of 0.050%), Immigrants from Ethiopia (86.1%, a difference of 0.050%), Immigrants from Lithuania (86.1%, a difference of 0.060%), and Norwegian (86.1%, a difference of 0.070%).
| Demographics | Rating | Rank | In Labor Force | Age 25-29 |
| Immigrants | Somalia | 100.0 /100 | #2 | Exceptional 87.1% |
| Somalis | 100.0 /100 | #3 | Exceptional 87.1% |
| Carpatho Rusyns | 100.0 /100 | #4 | Exceptional 87.0% |
| Luxembourgers | 100.0 /100 | #5 | Exceptional 86.9% |
| Slovenes | 100.0 /100 | #6 | Exceptional 86.4% |
| Immigrants | Bosnia and Herzegovina | 100.0 /100 | #7 | Exceptional 86.3% |
| Immigrants | Cabo Verde | 100.0 /100 | #8 | Exceptional 86.2% |
| Ethiopians | 100.0 /100 | #9 | Exceptional 86.2% |
| Liberians | 100.0 /100 | #10 | Exceptional 86.1% |
| Immigrants | Ethiopia | 100.0 /100 | #11 | Exceptional 86.1% |
| Immigrants | Lithuania | 100.0 /100 | #12 | Exceptional 86.1% |
| Norwegians | 100.0 /100 | #13 | Exceptional 86.1% |
| Latvians | 100.0 /100 | #14 | Exceptional 86.1% |
| Bolivians | 100.0 /100 | #15 | Exceptional 86.1% |
| Immigrants | Bolivia | 100.0 /100 | #16 | Exceptional 86.1% |
Demographics Similar to Immigrants from Eritrea by In Labor Force | Age 25-29
In terms of in labor force | age 25-29, the demographic groups most similar to Immigrants from Eritrea are Immigrants from India (85.7%, a difference of 0.010%), Macedonian (85.7%, a difference of 0.020%), Immigrants from Sierra Leone (85.7%, a difference of 0.020%), Immigrants from Greece (85.7%, a difference of 0.040%), and Immigrants from Albania (85.7%, a difference of 0.050%).
| Demographics | Rating | Rank | In Labor Force | Age 25-29 |
| Cypriots | 99.9 /100 | #35 | Exceptional 85.8% |
| Immigrants | Nepal | 99.9 /100 | #36 | Exceptional 85.8% |
| Poles | 99.9 /100 | #37 | Exceptional 85.8% |
| Sierra Leoneans | 99.9 /100 | #38 | Exceptional 85.8% |
| Croatians | 99.9 /100 | #39 | Exceptional 85.8% |
| Immigrants | Albania | 99.9 /100 | #40 | Exceptional 85.7% |
| Immigrants | Greece | 99.9 /100 | #41 | Exceptional 85.7% |
| Immigrants | Eritrea | 99.9 /100 | #42 | Exceptional 85.7% |
| Immigrants | India | 99.9 /100 | #43 | Exceptional 85.7% |
| Macedonians | 99.9 /100 | #44 | Exceptional 85.7% |
| Immigrants | Sierra Leone | 99.9 /100 | #45 | Exceptional 85.7% |
| Czechs | 99.8 /100 | #46 | Exceptional 85.6% |
| Turks | 99.8 /100 | #47 | Exceptional 85.6% |
| Italians | 99.8 /100 | #48 | Exceptional 85.6% |
| Swedes | 99.8 /100 | #49 | Exceptional 85.6% |