Immigrants from Thailand vs Immigrants from Denmark Median Household Income
COMPARE
Immigrants from Thailand
Immigrants from Denmark
Median Household Income
Median Household Income Comparison
Immigrants from Thailand
Immigrants from Denmark
$83,327
MEDIAN HOUSEHOLD INCOME
24.3/ 100
METRIC RATING
202nd/ 347
METRIC RANK
$98,510
MEDIAN HOUSEHOLD INCOME
100.0/ 100
METRIC RATING
32nd/ 347
METRIC RANK
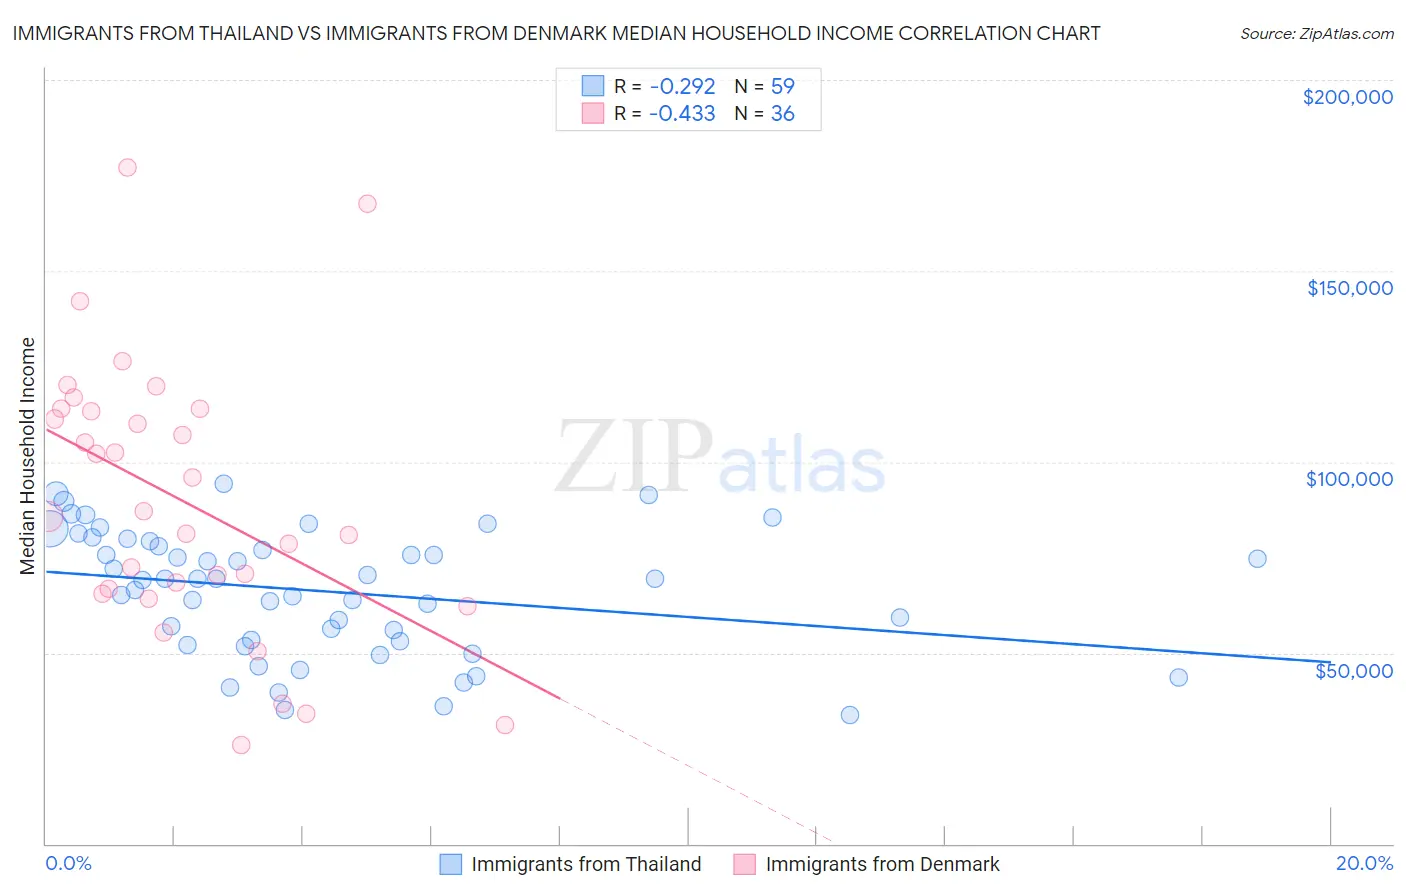
Immigrants from Thailand vs Immigrants from Denmark Median Household Income Correlation Chart
The statistical analysis conducted on geographies consisting of 316,905,677 people shows a weak negative correlation between the proportion of Immigrants from Thailand and median household income in the United States with a correlation coefficient (R) of -0.292 and weighted average of $83,327. Similarly, the statistical analysis conducted on geographies consisting of 136,400,553 people shows a moderate negative correlation between the proportion of Immigrants from Denmark and median household income in the United States with a correlation coefficient (R) of -0.433 and weighted average of $98,510, a difference of 18.2%.
Median Household Income Correlation Summary
| Measurement | Immigrants from Thailand | Immigrants from Denmark |
| Minimum | $33,750 | $26,000 |
| Maximum | $94,169 | $177,030 |
| Range | $60,419 | $151,030 |
| Mean | $66,115 | $89,771 |
| Median | $69,375 | $86,345 |
| Interquartile 25% (IQ1) | $53,069 | $66,126 |
| Interquartile 75% (IQ3) | $79,311 | $113,584 |
| Interquartile Range (IQR) | $26,242 | $47,458 |
| Standard Deviation (Sample) | $16,097 | $35,565 |
| Standard Deviation (Population) | $15,960 | $35,068 |
Similar Demographics by Median Household Income
Demographics Similar to Immigrants from Thailand by Median Household Income
In terms of median household income, the demographic groups most similar to Immigrants from Thailand are Tsimshian ($83,346, a difference of 0.020%), Spanish ($83,343, a difference of 0.020%), Immigrants from Cambodia ($83,304, a difference of 0.030%), German ($83,358, a difference of 0.040%), and Immigrants from Africa ($83,289, a difference of 0.050%).
| Demographics | Rating | Rank | Median Household Income |
| Immigrants | Armenia | 27.0 /100 | #195 | Fair $83,555 |
| French | 26.0 /100 | #196 | Fair $83,468 |
| Aleuts | 25.7 /100 | #197 | Fair $83,446 |
| Japanese | 25.1 /100 | #198 | Fair $83,395 |
| Germans | 24.6 /100 | #199 | Fair $83,358 |
| Tsimshian | 24.5 /100 | #200 | Fair $83,346 |
| Spanish | 24.4 /100 | #201 | Fair $83,343 |
| Immigrants | Thailand | 24.3 /100 | #202 | Fair $83,327 |
| Immigrants | Cambodia | 24.0 /100 | #203 | Fair $83,304 |
| Immigrants | Africa | 23.8 /100 | #204 | Fair $83,289 |
| Celtics | 22.7 /100 | #205 | Fair $83,193 |
| Immigrants | Kenya | 21.3 /100 | #206 | Fair $83,068 |
| Dutch | 20.3 /100 | #207 | Fair $82,971 |
| French Canadians | 18.7 /100 | #208 | Poor $82,810 |
| Immigrants | Iraq | 16.7 /100 | #209 | Poor $82,594 |
Demographics Similar to Immigrants from Denmark by Median Household Income
In terms of median household income, the demographic groups most similar to Immigrants from Denmark are Chinese ($98,496, a difference of 0.010%), Russian ($98,008, a difference of 0.51%), Immigrants from Switzerland ($97,979, a difference of 0.54%), Turkish ($99,389, a difference of 0.89%), and Immigrants from Pakistan ($97,528, a difference of 1.0%).
| Demographics | Rating | Rank | Median Household Income |
| Immigrants | Sweden | 100.0 /100 | #25 | Exceptional $100,699 |
| Immigrants | Belgium | 100.0 /100 | #26 | Exceptional $100,306 |
| Bhutanese | 100.0 /100 | #27 | Exceptional $100,151 |
| Immigrants | Sri Lanka | 100.0 /100 | #28 | Exceptional $99,943 |
| Immigrants | Asia | 100.0 /100 | #29 | Exceptional $99,933 |
| Immigrants | Northern Europe | 100.0 /100 | #30 | Exceptional $99,813 |
| Turks | 100.0 /100 | #31 | Exceptional $99,389 |
| Immigrants | Denmark | 100.0 /100 | #32 | Exceptional $98,510 |
| Chinese | 100.0 /100 | #33 | Exceptional $98,496 |
| Russians | 100.0 /100 | #34 | Exceptional $98,008 |
| Immigrants | Switzerland | 100.0 /100 | #35 | Exceptional $97,979 |
| Immigrants | Pakistan | 100.0 /100 | #36 | Exceptional $97,528 |
| Latvians | 100.0 /100 | #37 | Exceptional $97,311 |
| Immigrants | Indonesia | 100.0 /100 | #38 | Exceptional $97,297 |
| Afghans | 100.0 /100 | #39 | Exceptional $97,026 |