Maltese vs Immigrants from Denmark Median Household Income
COMPARE
Maltese
Immigrants from Denmark
Median Household Income
Median Household Income Comparison
Maltese
Immigrants from Denmark
$97,015
MEDIAN HOUSEHOLD INCOME
100.0/ 100
METRIC RATING
40th/ 347
METRIC RANK
$98,510
MEDIAN HOUSEHOLD INCOME
100.0/ 100
METRIC RATING
32nd/ 347
METRIC RANK
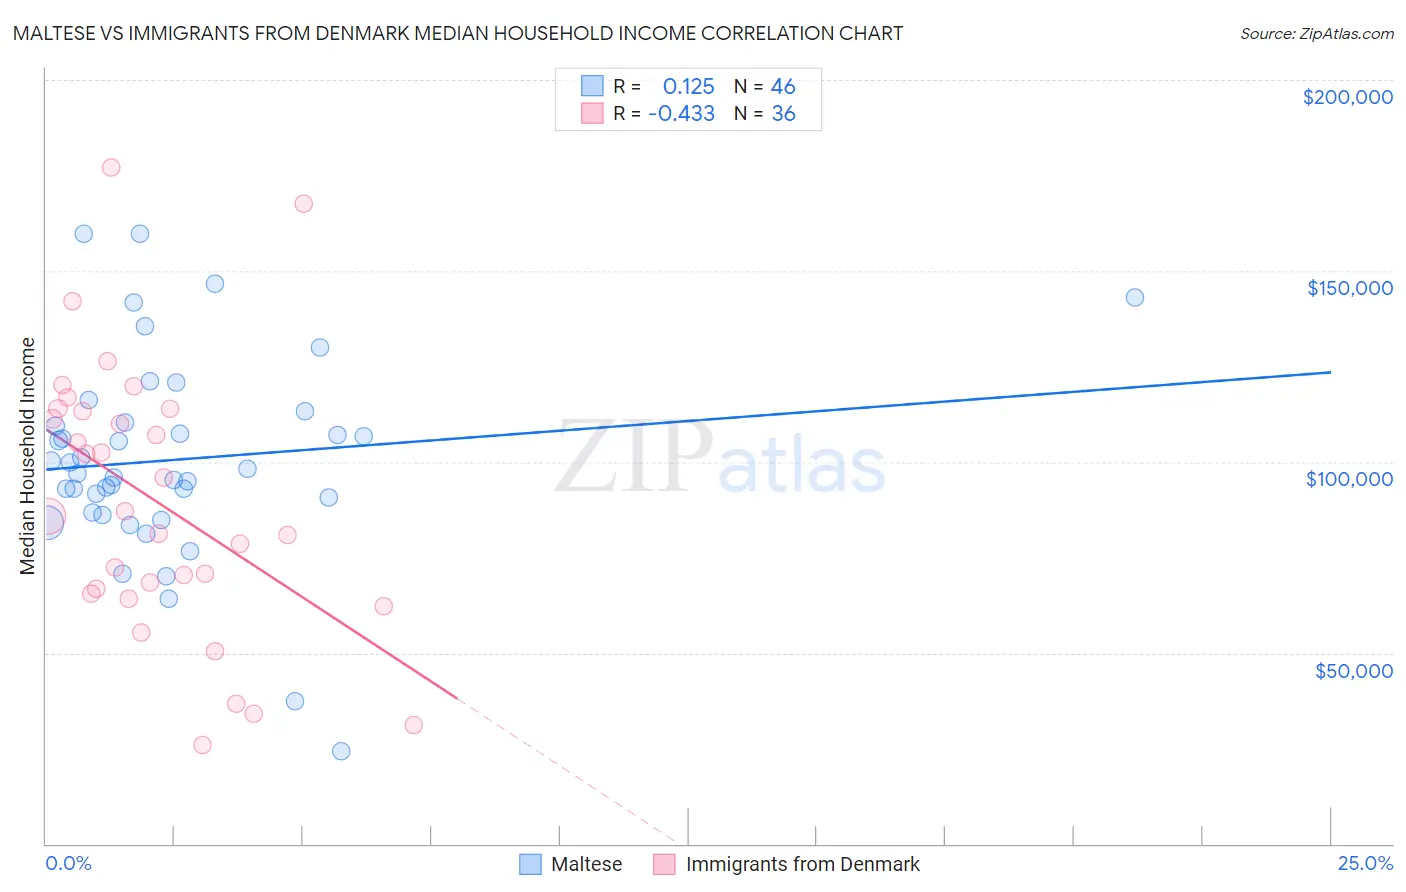
Maltese vs Immigrants from Denmark Median Household Income Correlation Chart
The statistical analysis conducted on geographies consisting of 126,420,319 people shows a poor positive correlation between the proportion of Maltese and median household income in the United States with a correlation coefficient (R) of 0.125 and weighted average of $97,015. Similarly, the statistical analysis conducted on geographies consisting of 136,400,553 people shows a moderate negative correlation between the proportion of Immigrants from Denmark and median household income in the United States with a correlation coefficient (R) of -0.433 and weighted average of $98,510, a difference of 1.5%.
Median Household Income Correlation Summary
| Measurement | Maltese | Immigrants from Denmark |
| Minimum | $24,250 | $26,000 |
| Maximum | $159,651 | $177,030 |
| Range | $135,401 | $151,030 |
| Mean | $100,571 | $89,771 |
| Median | $97,403 | $86,345 |
| Interquartile 25% (IQ1) | $86,626 | $66,126 |
| Interquartile 75% (IQ3) | $110,225 | $113,584 |
| Interquartile Range (IQR) | $23,599 | $47,458 |
| Standard Deviation (Sample) | $26,669 | $35,565 |
| Standard Deviation (Population) | $26,378 | $35,068 |
Demographics Similar to Maltese and Immigrants from Denmark by Median Household Income
In terms of median household income, the demographic groups most similar to Maltese are Afghan ($97,026, a difference of 0.010%), Immigrants from Turkey ($96,964, a difference of 0.050%), Immigrants from Lithuania ($96,836, a difference of 0.18%), Immigrants from France ($96,743, a difference of 0.28%), and Immigrants from Indonesia ($97,297, a difference of 0.29%). Similarly, the demographic groups most similar to Immigrants from Denmark are Chinese ($98,496, a difference of 0.010%), Russian ($98,008, a difference of 0.51%), Immigrants from Switzerland ($97,979, a difference of 0.54%), Turkish ($99,389, a difference of 0.89%), and Immigrants from Pakistan ($97,528, a difference of 1.0%).
| Demographics | Rating | Rank | Median Household Income |
| Immigrants | Belgium | 100.0 /100 | #26 | Exceptional $100,306 |
| Bhutanese | 100.0 /100 | #27 | Exceptional $100,151 |
| Immigrants | Sri Lanka | 100.0 /100 | #28 | Exceptional $99,943 |
| Immigrants | Asia | 100.0 /100 | #29 | Exceptional $99,933 |
| Immigrants | Northern Europe | 100.0 /100 | #30 | Exceptional $99,813 |
| Turks | 100.0 /100 | #31 | Exceptional $99,389 |
| Immigrants | Denmark | 100.0 /100 | #32 | Exceptional $98,510 |
| Chinese | 100.0 /100 | #33 | Exceptional $98,496 |
| Russians | 100.0 /100 | #34 | Exceptional $98,008 |
| Immigrants | Switzerland | 100.0 /100 | #35 | Exceptional $97,979 |
| Immigrants | Pakistan | 100.0 /100 | #36 | Exceptional $97,528 |
| Latvians | 100.0 /100 | #37 | Exceptional $97,311 |
| Immigrants | Indonesia | 100.0 /100 | #38 | Exceptional $97,297 |
| Afghans | 100.0 /100 | #39 | Exceptional $97,026 |
| Maltese | 100.0 /100 | #40 | Exceptional $97,015 |
| Immigrants | Turkey | 100.0 /100 | #41 | Exceptional $96,964 |
| Immigrants | Lithuania | 99.9 /100 | #42 | Exceptional $96,836 |
| Immigrants | France | 99.9 /100 | #43 | Exceptional $96,743 |
| Immigrants | Greece | 99.9 /100 | #44 | Exceptional $96,675 |
| Israelis | 99.9 /100 | #45 | Exceptional $96,552 |
| Australians | 99.9 /100 | #46 | Exceptional $96,490 |