Immigrants from Morocco vs American Median Household Income
COMPARE
Immigrants from Morocco
American
Median Household Income
Median Household Income Comparison
Immigrants from Morocco
Americans
$87,930
MEDIAN HOUSEHOLD INCOME
86.0/ 100
METRIC RATING
141st/ 347
METRIC RANK
$75,932
MEDIAN HOUSEHOLD INCOME
0.3/ 100
METRIC RATING
266th/ 347
METRIC RANK
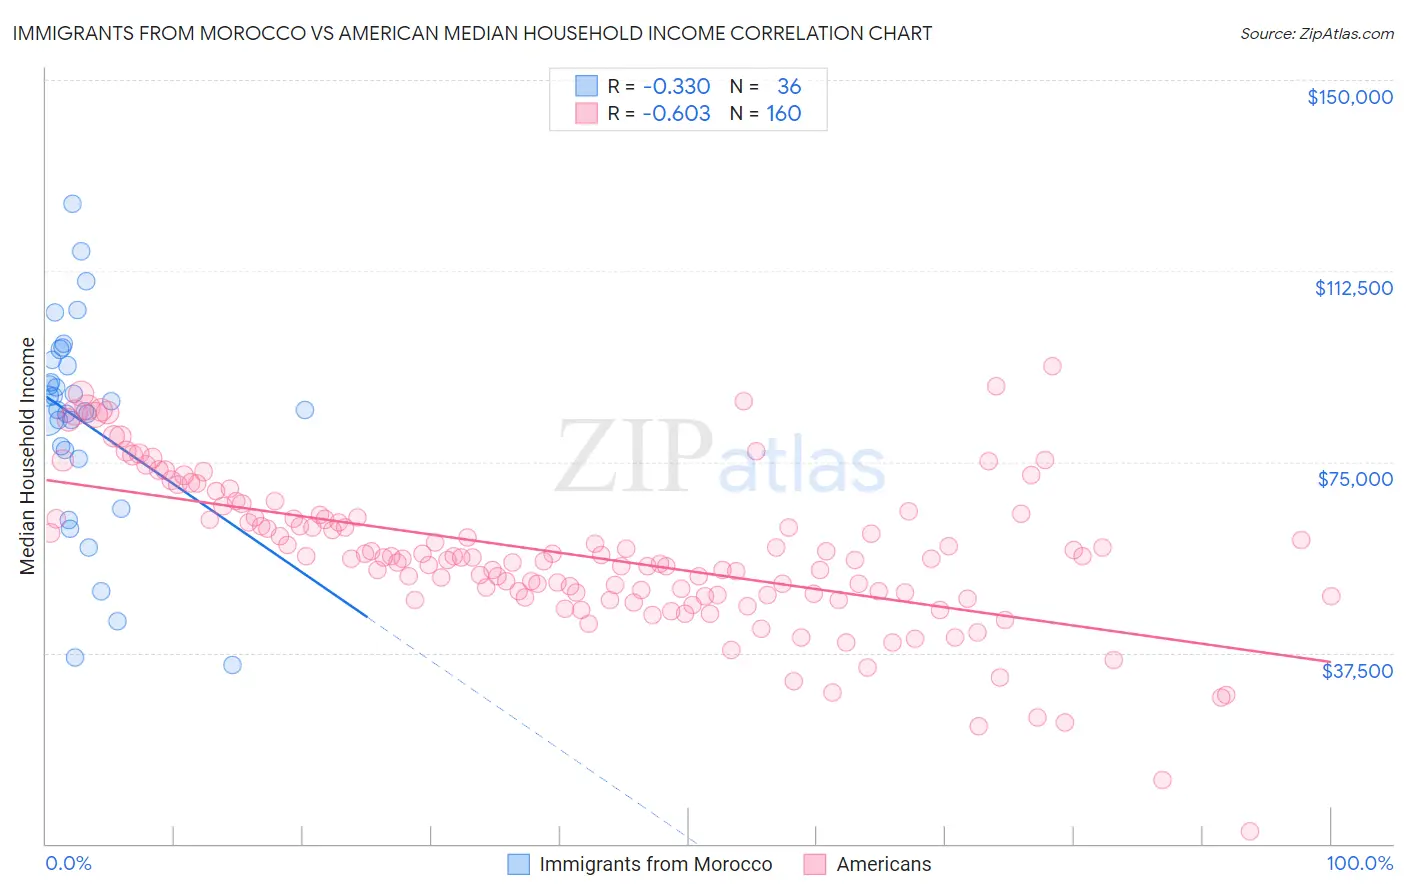
Immigrants from Morocco vs American Median Household Income Correlation Chart
The statistical analysis conducted on geographies consisting of 178,909,382 people shows a mild negative correlation between the proportion of Immigrants from Morocco and median household income in the United States with a correlation coefficient (R) of -0.330 and weighted average of $87,930. Similarly, the statistical analysis conducted on geographies consisting of 580,584,472 people shows a significant negative correlation between the proportion of Americans and median household income in the United States with a correlation coefficient (R) of -0.603 and weighted average of $75,932, a difference of 15.8%.
Median Household Income Correlation Summary
| Measurement | Immigrants from Morocco | American |
| Minimum | $35,000 | $2,499 |
| Maximum | $125,707 | $93,750 |
| Range | $90,707 | $91,251 |
| Mean | $82,911 | $56,747 |
| Median | $85,268 | $56,097 |
| Interquartile 25% (IQ1) | $76,412 | $48,888 |
| Interquartile 75% (IQ3) | $94,485 | $64,069 |
| Interquartile Range (IQR) | $18,073 | $15,181 |
| Standard Deviation (Sample) | $20,524 | $14,812 |
| Standard Deviation (Population) | $20,237 | $14,765 |
Similar Demographics by Median Household Income
Demographics Similar to Immigrants from Morocco by Median Household Income
In terms of median household income, the demographic groups most similar to Immigrants from Morocco are Lebanese ($88,091, a difference of 0.18%), Canadian ($87,769, a difference of 0.18%), Danish ($87,676, a difference of 0.29%), Serbian ($87,572, a difference of 0.41%), and Ugandan ($87,557, a difference of 0.43%).
| Demographics | Rating | Rank | Median Household Income |
| Swedes | 90.0 /100 | #134 | Exceptional $88,524 |
| Immigrants | Sierra Leone | 89.9 /100 | #135 | Excellent $88,498 |
| Poles | 89.7 /100 | #136 | Excellent $88,472 |
| Sierra Leoneans | 89.6 /100 | #137 | Excellent $88,463 |
| Arabs | 89.2 /100 | #138 | Excellent $88,398 |
| Immigrants | Chile | 89.2 /100 | #139 | Excellent $88,388 |
| Lebanese | 87.2 /100 | #140 | Excellent $88,091 |
| Immigrants | Morocco | 86.0 /100 | #141 | Excellent $87,930 |
| Canadians | 84.7 /100 | #142 | Excellent $87,769 |
| Danes | 83.9 /100 | #143 | Excellent $87,676 |
| Serbians | 83.0 /100 | #144 | Excellent $87,572 |
| Ugandans | 82.9 /100 | #145 | Excellent $87,557 |
| Immigrants | Uganda | 82.8 /100 | #146 | Excellent $87,553 |
| South American Indians | 81.8 /100 | #147 | Excellent $87,446 |
| Costa Ricans | 80.0 /100 | #148 | Excellent $87,262 |
Demographics Similar to Americans by Median Household Income
In terms of median household income, the demographic groups most similar to Americans are Immigrants from Belize ($75,938, a difference of 0.010%), Guatemalan ($75,961, a difference of 0.040%), German Russian ($75,856, a difference of 0.10%), Immigrants from Jamaica ($75,851, a difference of 0.11%), and Cape Verdean ($75,848, a difference of 0.11%).
| Demographics | Rating | Rank | Median Household Income |
| Spanish American Indians | 0.4 /100 | #259 | Tragic $76,670 |
| Jamaicans | 0.4 /100 | #260 | Tragic $76,583 |
| Immigrants | Grenada | 0.4 /100 | #261 | Tragic $76,517 |
| French American Indians | 0.4 /100 | #262 | Tragic $76,387 |
| Alaskan Athabascans | 0.4 /100 | #263 | Tragic $76,383 |
| Guatemalans | 0.3 /100 | #264 | Tragic $75,961 |
| Immigrants | Belize | 0.3 /100 | #265 | Tragic $75,938 |
| Americans | 0.3 /100 | #266 | Tragic $75,932 |
| German Russians | 0.3 /100 | #267 | Tragic $75,856 |
| Immigrants | Jamaica | 0.3 /100 | #268 | Tragic $75,851 |
| Cape Verdeans | 0.3 /100 | #269 | Tragic $75,848 |
| Hmong | 0.3 /100 | #270 | Tragic $75,839 |
| Pennsylvania Germans | 0.3 /100 | #271 | Tragic $75,814 |
| Somalis | 0.3 /100 | #272 | Tragic $75,782 |
| Liberians | 0.2 /100 | #273 | Tragic $75,667 |