Ethiopian vs American In Labor Force | Age 35-44
COMPARE
Ethiopian
American
In Labor Force | Age 35-44
In Labor Force | Age 35-44 Comparison
Ethiopians
Americans
85.9%
IN LABOR FORCE | AGE 35-44
100.0/ 100
METRIC RATING
9th/ 347
METRIC RANK
82.4%
IN LABOR FORCE | AGE 35-44
0.0/ 100
METRIC RATING
302nd/ 347
METRIC RANK
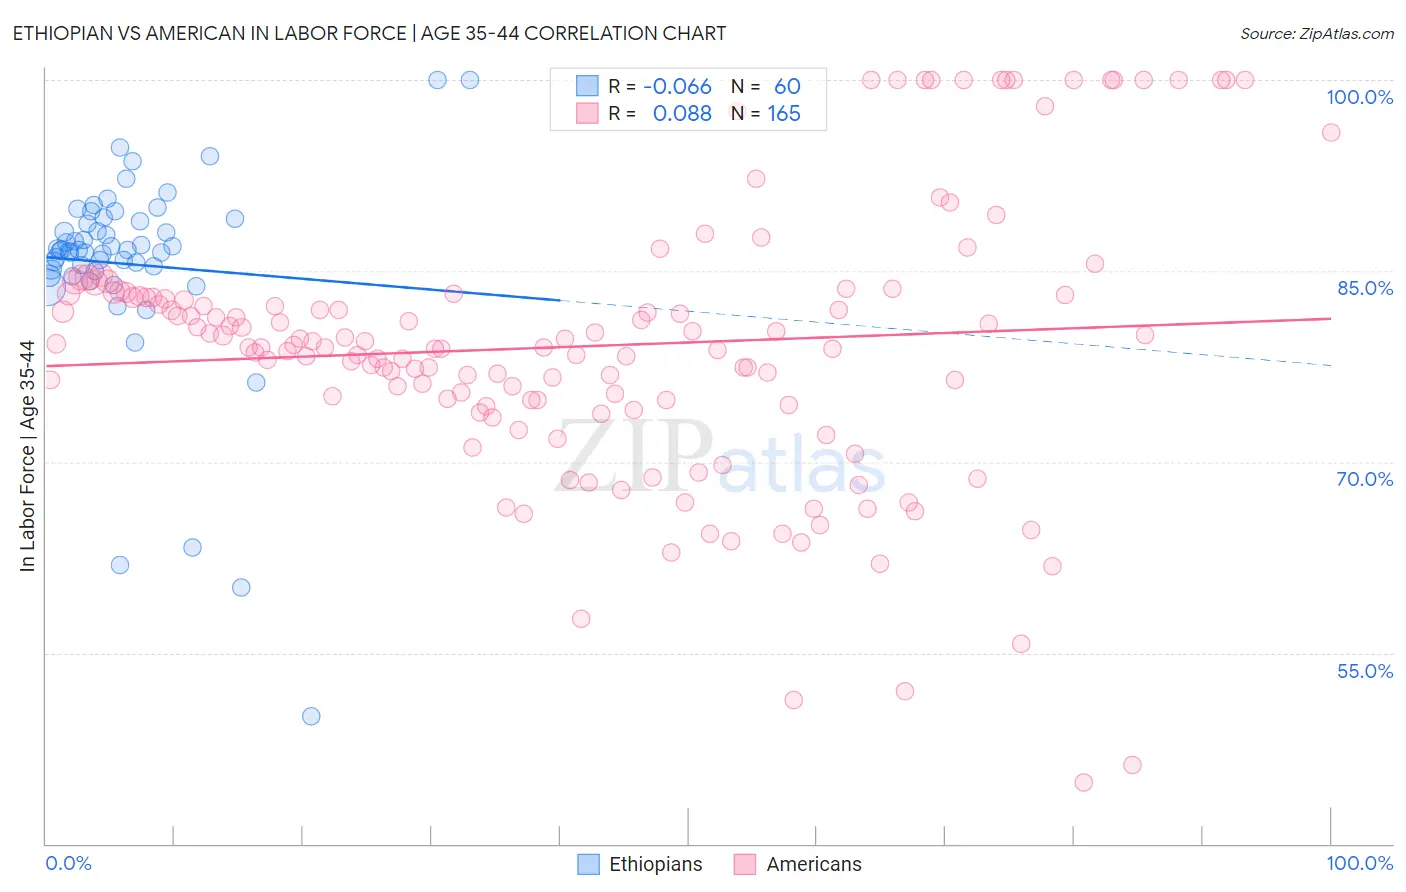
Ethiopian vs American In Labor Force | Age 35-44 Correlation Chart
The statistical analysis conducted on geographies consisting of 223,141,148 people shows a slight negative correlation between the proportion of Ethiopians and labor force participation rate among population between the ages 35 and 44 in the United States with a correlation coefficient (R) of -0.066 and weighted average of 85.9%. Similarly, the statistical analysis conducted on geographies consisting of 581,120,532 people shows a slight positive correlation between the proportion of Americans and labor force participation rate among population between the ages 35 and 44 in the United States with a correlation coefficient (R) of 0.088 and weighted average of 82.4%, a difference of 4.2%.
In Labor Force | Age 35-44 Correlation Summary
| Measurement | Ethiopian | American |
| Minimum | 50.0% | 44.8% |
| Maximum | 100.0% | 100.0% |
| Range | 50.0% | 55.2% |
| Mean | 85.5% | 79.1% |
| Median | 86.7% | 79.0% |
| Interquartile 25% (IQ1) | 85.0% | 74.7% |
| Interquartile 75% (IQ3) | 89.0% | 83.2% |
| Interquartile Range (IQR) | 3.9% | 8.5% |
| Standard Deviation (Sample) | 8.3% | 10.7% |
| Standard Deviation (Population) | 8.2% | 10.7% |
Similar Demographics by In Labor Force | Age 35-44
Demographics Similar to Ethiopians by In Labor Force | Age 35-44
In terms of in labor force | age 35-44, the demographic groups most similar to Ethiopians are Immigrants from Ethiopia (85.9%, a difference of 0.0%), Cape Verdean (85.8%, a difference of 0.13%), Immigrants from Cameroon (85.8%, a difference of 0.16%), Immigrants from Sierra Leone (86.1%, a difference of 0.18%), and Bolivian (86.1%, a difference of 0.21%).
| Demographics | Rating | Rank | In Labor Force | Age 35-44 |
| Luxembourgers | 100.0 /100 | #2 | Exceptional 86.4% |
| Immigrants | Bolivia | 100.0 /100 | #3 | Exceptional 86.2% |
| Immigrants | Cabo Verde | 100.0 /100 | #4 | Exceptional 86.2% |
| Zimbabweans | 100.0 /100 | #5 | Exceptional 86.1% |
| Bolivians | 100.0 /100 | #6 | Exceptional 86.1% |
| Immigrants | Sierra Leone | 100.0 /100 | #7 | Exceptional 86.1% |
| Immigrants | Ethiopia | 100.0 /100 | #8 | Exceptional 85.9% |
| Ethiopians | 100.0 /100 | #9 | Exceptional 85.9% |
| Cape Verdeans | 100.0 /100 | #10 | Exceptional 85.8% |
| Immigrants | Cameroon | 100.0 /100 | #11 | Exceptional 85.8% |
| Liberians | 100.0 /100 | #12 | Exceptional 85.7% |
| Somalis | 100.0 /100 | #13 | Exceptional 85.6% |
| Immigrants | Somalia | 100.0 /100 | #14 | Exceptional 85.6% |
| Norwegians | 100.0 /100 | #15 | Exceptional 85.6% |
| Immigrants | Ireland | 100.0 /100 | #16 | Exceptional 85.6% |
Demographics Similar to Americans by In Labor Force | Age 35-44
In terms of in labor force | age 35-44, the demographic groups most similar to Americans are Nepalese (82.4%, a difference of 0.0%), Marshallese (82.4%, a difference of 0.010%), Spanish American Indian (82.5%, a difference of 0.080%), Central American Indian (82.5%, a difference of 0.10%), and Tlingit-Haida (82.5%, a difference of 0.16%).
| Demographics | Rating | Rank | In Labor Force | Age 35-44 |
| Immigrants | Lebanon | 0.0 /100 | #295 | Tragic 82.7% |
| Mexican American Indians | 0.0 /100 | #296 | Tragic 82.6% |
| Hmong | 0.0 /100 | #297 | Tragic 82.6% |
| Ottawa | 0.0 /100 | #298 | Tragic 82.6% |
| Tlingit-Haida | 0.0 /100 | #299 | Tragic 82.5% |
| Central American Indians | 0.0 /100 | #300 | Tragic 82.5% |
| Spanish American Indians | 0.0 /100 | #301 | Tragic 82.5% |
| Americans | 0.0 /100 | #302 | Tragic 82.4% |
| Nepalese | 0.0 /100 | #303 | Tragic 82.4% |
| Marshallese | 0.0 /100 | #304 | Tragic 82.4% |
| Shoshone | 0.0 /100 | #305 | Tragic 82.2% |
| Blacks/African Americans | 0.0 /100 | #306 | Tragic 82.2% |
| Hispanics or Latinos | 0.0 /100 | #307 | Tragic 82.1% |
| Immigrants | Central America | 0.0 /100 | #308 | Tragic 82.0% |
| Cree | 0.0 /100 | #309 | Tragic 82.0% |