English vs Immigrants from Yemen Median Male Earnings
COMPARE
English
Immigrants from Yemen
Median Male Earnings
Median Male Earnings Comparison
English
Immigrants from Yemen
$55,747
MEDIAN MALE EARNINGS
77.4/ 100
METRIC RATING
149th/ 347
METRIC RANK
$44,083
MEDIAN MALE EARNINGS
0.0/ 100
METRIC RATING
334th/ 347
METRIC RANK
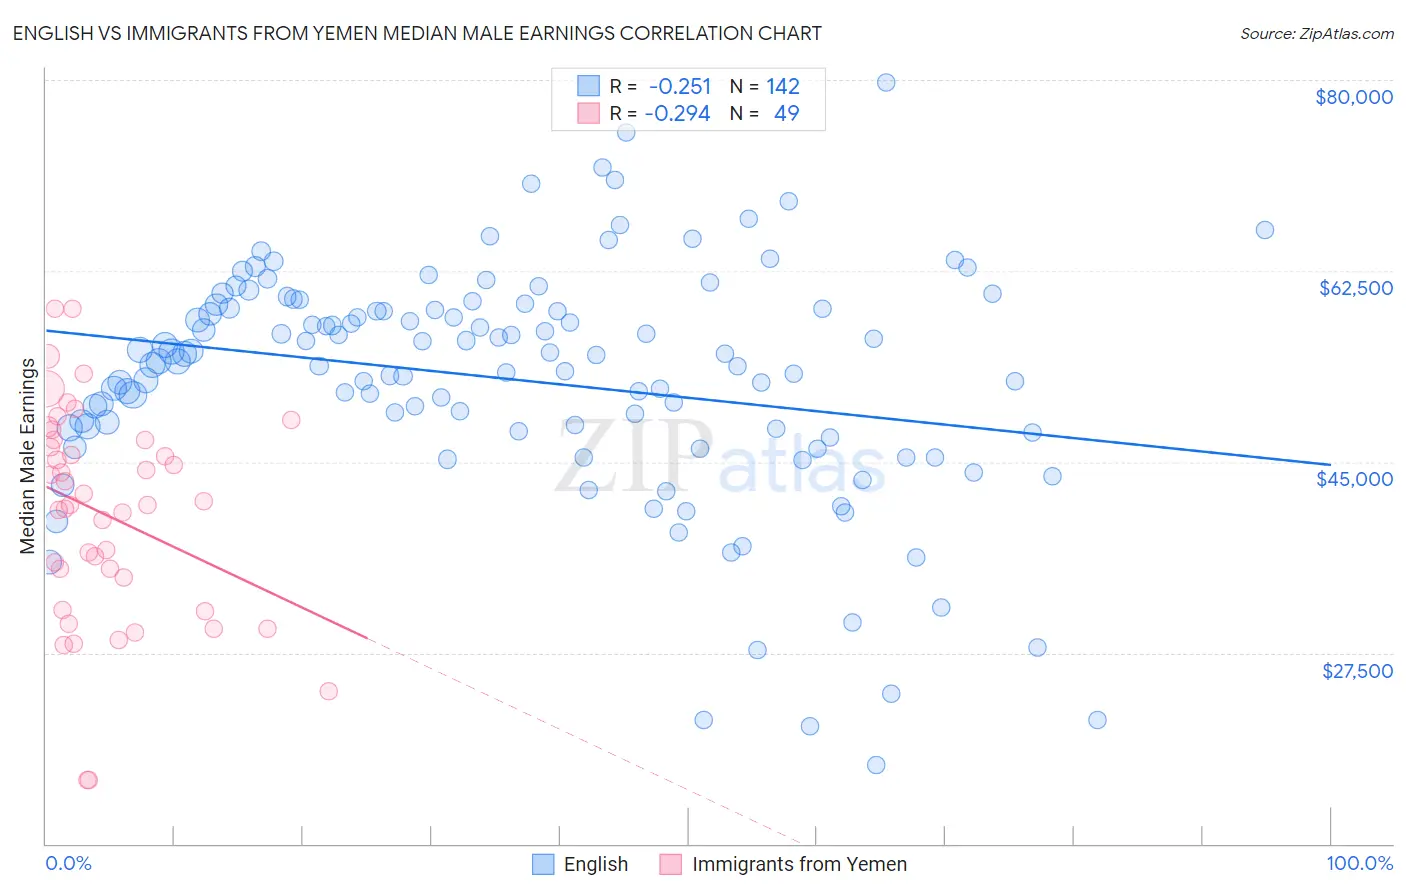
English vs Immigrants from Yemen Median Male Earnings Correlation Chart
The statistical analysis conducted on geographies consisting of 577,846,764 people shows a weak negative correlation between the proportion of English and median male earnings in the United States with a correlation coefficient (R) of -0.251 and weighted average of $55,747. Similarly, the statistical analysis conducted on geographies consisting of 82,424,994 people shows a weak negative correlation between the proportion of Immigrants from Yemen and median male earnings in the United States with a correlation coefficient (R) of -0.294 and weighted average of $44,083, a difference of 26.5%.
Median Male Earnings Correlation Summary
| Measurement | English | Immigrants from Yemen |
| Minimum | $17,188 | $15,864 |
| Maximum | $79,824 | $59,038 |
| Range | $62,636 | $43,174 |
| Mean | $52,541 | $40,188 |
| Median | $54,211 | $41,048 |
| Interquartile 25% (IQ1) | $47,796 | $32,940 |
| Interquartile 75% (IQ3) | $58,992 | $47,016 |
| Interquartile Range (IQR) | $11,196 | $14,075 |
| Standard Deviation (Sample) | $10,836 | $9,775 |
| Standard Deviation (Population) | $10,798 | $9,674 |
Similar Demographics by Median Male Earnings
Demographics Similar to English by Median Male Earnings
In terms of median male earnings, the demographic groups most similar to English are Swiss ($55,731, a difference of 0.030%), Immigrants from Oceania ($55,712, a difference of 0.060%), Scottish ($55,793, a difference of 0.080%), Immigrants from Philippines ($55,809, a difference of 0.11%), and Peruvian ($55,659, a difference of 0.16%).
| Demographics | Rating | Rank | Median Male Earnings |
| Ethiopians | 84.8 /100 | #142 | Excellent $56,243 |
| Sri Lankans | 83.4 /100 | #143 | Excellent $56,136 |
| Immigrants | Uganda | 82.4 /100 | #144 | Excellent $56,064 |
| Norwegians | 80.9 /100 | #145 | Excellent $55,965 |
| Immigrants | Chile | 80.7 /100 | #146 | Excellent $55,954 |
| Immigrants | Philippines | 78.4 /100 | #147 | Good $55,809 |
| Scottish | 78.2 /100 | #148 | Good $55,793 |
| English | 77.4 /100 | #149 | Good $55,747 |
| Swiss | 77.1 /100 | #150 | Good $55,731 |
| Immigrants | Oceania | 76.8 /100 | #151 | Good $55,712 |
| Peruvians | 75.8 /100 | #152 | Good $55,659 |
| Immigrants | Nepal | 75.0 /100 | #153 | Good $55,615 |
| Taiwanese | 73.9 /100 | #154 | Good $55,556 |
| Scandinavians | 73.4 /100 | #155 | Good $55,527 |
| Immigrants | Ethiopia | 71.6 /100 | #156 | Good $55,434 |
Demographics Similar to Immigrants from Yemen by Median Male Earnings
In terms of median male earnings, the demographic groups most similar to Immigrants from Yemen are Spanish American Indian ($44,010, a difference of 0.17%), Immigrants from Congo ($44,204, a difference of 0.27%), Immigrants from Cuba ($43,461, a difference of 1.4%), Bahamian ($44,756, a difference of 1.5%), and Native/Alaskan ($44,775, a difference of 1.6%).
| Demographics | Rating | Rank | Median Male Earnings |
| Immigrants | Bahamas | 0.0 /100 | #327 | Tragic $45,176 |
| Kiowa | 0.0 /100 | #328 | Tragic $45,094 |
| Yakama | 0.0 /100 | #329 | Tragic $45,002 |
| Immigrants | Mexico | 0.0 /100 | #330 | Tragic $44,960 |
| Natives/Alaskans | 0.0 /100 | #331 | Tragic $44,775 |
| Bahamians | 0.0 /100 | #332 | Tragic $44,756 |
| Immigrants | Congo | 0.0 /100 | #333 | Tragic $44,204 |
| Immigrants | Yemen | 0.0 /100 | #334 | Tragic $44,083 |
| Spanish American Indians | 0.0 /100 | #335 | Tragic $44,010 |
| Immigrants | Cuba | 0.0 /100 | #336 | Tragic $43,461 |
| Menominee | 0.0 /100 | #337 | Tragic $42,581 |
| Crow | 0.0 /100 | #338 | Tragic $42,434 |
| Pima | 0.0 /100 | #339 | Tragic $42,357 |
| Navajo | 0.0 /100 | #340 | Tragic $42,098 |
| Hopi | 0.0 /100 | #341 | Tragic $42,060 |